/
TEMPO NO 2  Validation Ron Cohen, UC Berkeley TEMPO NO 2  Validation Ron Cohen, UC Berkeley

TEMPO NO 2 Validation Ron Cohen, UC Berkeley - PowerPoint Presentation

radions
radions . @radions
Follow
343 views
Uploaded On 2020-06-23

TEMPO NO 2 Validation Ron Cohen, UC Berkeley - PPT Presentation

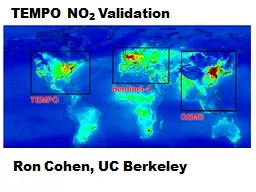
1 Precision of 1x10 15 moleculescm 2 05 ppb in the PBL Approach 3 Pandoras for 1 month 4 seasons Contract requirement Most approaches to using the data assumewill work better if the observations have little bias or a Gaussian distribution of bias ID: 784099

amp chem russell validation chem amp validation russell behr terrain albedo day phys 2011 atmos omi berkeley strategies product

Share:

Link:

Embed:

Download Presentation from below link

Download The PPT/PDF document "TEMPO NO 2 Validation Ron Cohen, UC Ber..." is the property of its rightful owner. Permission is granted to download and print the materials on this web site for personal, non-commercial use only, and to display it on your personal computer provided you do not modify the materials and that you retain all copyright notices contained in the materials. By downloading content from our website, you accept the terms of this agreement.


Presentation Transcript

Slide1

TEMPO NO

2

Validation

Ron Cohen, UC Berkeley

Slide2

1. Precision of 1x10

15 molecules/cm

2 (~0.5 ppb in the PBL)

Approach: ~3

Pandoras for 1 month; 4 seasons

Contract requirement

Slide3

Most approaches to using the data assume/will work better if the observations have little bias (or a Gaussian distribution of bias).

We want the data to be unbiased with respect to viewing and solar zenith angles (time of day), cloudiness, aerosol, albedo (several comments about this yesterday).

NO

2

Validation issues

Slide4

Los Angeles: WRF-Chem

Slide5

from Choi et al. 2014

observations

modeled fit

1σ variation range

Particulate Matter

(co-emitted with CO

2

, NO

x

, CO, …)

Slide6

NASA standard

BEHR

Terrain pressure

High-res terrain database,

center

of OMI footprint

High-res terrain database,

average

over OMI footprint

Terrain reflectivity

Monthly

1° × 1°

MODIS, 8 day 0.05° × 0.05°

NO

2

profile shape

Annually

2° × 2.5°

WRF-Chem, Monthly 4 × 4 km

2

(CA&NV)

12 x 12 km

2 U.S.CloudsOMI cloud productMODIS cloud product

Russell et al., Atmos Chem & Phys 11, 8543-8554, 2011

http://behr.cchem.berkeley.edu/

/

Slide7

Terrain Reflectivity (Albedo)

NASA Standard Product June 2008

BEHR June 2008

MODIS True Color

SP NO

2

June 18, 2008

OMI Monthly Albedo

MODIS 8 day Albedo

Russell et al., Atmos Chem & Phys, 2011

Slide8

Terrain Reflectivity (Albedo)

Russell et al., Atmos Chem & Phys, 2011

Histogram of systematic errors

Slide9

NO

2

profile shape

Russell et al., Atmos Chem & Phys, 2011

Histogram of systematic errors

Slide10

The BEHR product is generally higher in urban regions and lower in rural regions than the operational products

BEHR

% Difference

Standard Product

Russell et al., Atmos Chem & Phys, 2011

Slide11

Trends in cities are similar while trends at power plants are more variable

Russell et al.,

ACP

2012

47 cities, 23 power plants!

Slide12

Example: look in remote places with uniform (but low) NO

2

columns and make sure observed variation is geophysical sensible—not driven by viewing angle etc.

Stare at one location for an hour (at midday) and check that clouds moving across the scene don’t affect the interpretation.

Examine repeats at a power plant with near constant emissions and check that there is little variation of NO2

with time of day.

NO

2

Validation Strategies

Check all possible avenues for internal consistency

Slide13

OMI Berkeley High-resolution Retrieval (BEHR)

0

1

2

3

4

5

6

7

8

9 10x1015NO2 (molecules cm–2)May–October 2005–2006

Slide14

NO

2

Validation Strategies

Additional “conventional data”

Aircraft/ground based experiments e.g. DISCOVER; KORUS

Surface network

additional PANDORA’s

Slide15

NO

2

Validation Strategies

“unconventional data”

Slide16

CO

2

Emissions

in San Francisco bay area at 1km resolution

Slide17

NO

NO

2O3CO

CO

2aerosol

Slide18

BEACO

2

N observing network http://beacon.berkeley.edu/

Slide19

Vaisala

GMP343 NDIR CO

2 Sensor

Shinyei Grove

ParticulateSensor

Electrochemical O

3

, NO, NO

2

& CO

Sensors

Slide20

BEACO

2N CO

2 2013Sites:

Laurel Korematsu HeadRoyceBurckhalter Kaiser ODowd ElCerritoPrescott

CollegePrep

StLiz

NOakland

Slide21

WRF-STILT for day bridge was closed

Alex

Turner

10 km

10 km

Slide22

NO

2 Validation Strategies

“other unconventional data?”

Profiling with small sensors and

dronesLIDARSSondes