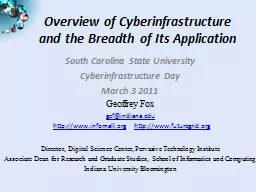
/
Overview of Cyberinfrastructure and the Breadth of Its Application Overview of Cyberinfrastructure and the Breadth of Its Application

Overview of Cyberinfrastructure and the Breadth of Its Application - PowerPoint Presentation

rayfantasy
rayfantasy . @rayfantasy
Follow
343 views
Uploaded On 2020-06-16

Overview of Cyberinfrastructure and the Breadth of Its Application - PPT Presentation

South Carolina State University Cyberinfrastructure Day March 3 2011 Geoffrey Fox gcfindianaedu httpwwwinfomallorg httpwwwfuturegridorg Director Digital Science Center Pervasive Technology Institute ID: 778928

science data clouds computing data science computing clouds software futuregrid cloud virtual map parallel teragrid support services university key

Share:

Link:

Embed:

Download Presentation from below link

Download The PPT/PDF document "Overview of Cyberinfrastructure and the ..." is the property of its rightful owner. Permission is granted to download and print the materials on this web site for personal, non-commercial use only, and to display it on your personal computer provided you do not modify the materials and that you retain all copyright notices contained in the materials. By downloading content from our website, you accept the terms of this agreement.


Presentation Transcript

Slide1

Overview of Cyberinfrastructure and the Breadth of Its Application

South Carolina State UniversityCyberinfrastructure DayMarch 3 2011

Geoffrey Fox

gcf@indiana.edu

http://www.infomall.org

http://www.futuregrid.org

Director, Digital Science Center, Pervasive Technology Institute

Associate Dean for Research and Graduate Studies,  School of Informatics and Computing

Indiana University Bloomington

Slide2

2

2

What is Cyberinfrastructure

Cyberinfrastructure is (from NSF) infrastructure that supports

distributed research and learning

(

e-Science, e-Research, e-Education

)

Links data, people, computers

Exploits

Internet technology

(

Web2.0

and

Clouds

) adding (via

Grid

technology) management, security, supercomputers etc.

It has two aspects:

parallel

– low latency (microseconds) between nodes and

distributed

– highish latency (milliseconds) between nodes

Parallel needed to get

high performance

on

individual

large simulations, data analysis etc.; must

decompose problem

Distributed aspect

integrates

already distinct components – especially natural for data (as in biology databases etc.)

Slide3

3

3

e-moreorlessanything

e-Science

is about global collaboration in key areas of science, and the next generation of infrastructure that will enable it.’ from inventor of term

John Taylor

Director General of Research Councils UK, Office of Science and Technology

e-Science

is about developing tools and technologies that allow scientists to do ‘faster, better or different’ research

Similarly

e-Business

captures the emerging view of corporations as dynamic

virtual organizations

linking employees, customers and stakeholders across the world.

This generalizes to

e-moreorlessanything

including

e-

DigitalLibrary

,

e-

SocialScience

,

e-

HavingFun

and

e-Education

A

deluge of data

of unprecedented and inevitable size must be managed and understood.

People

(virtual organizations),

computers

,

data

(including

sensors

and

instruments

)

must be linked via hardware and software

networks

Slide4

Important Trends

Data Deluge in all fields of scienceMulticore implies parallel computing important again

Performance from extra cores – not extra clock speed

GPU enhanced systems can give big power boost

Clouds – new commercially supported data center model replacing compute

grids (and your general purpose computer center)Light weight clients: Sensors, Smartphones and tablets accessing and supported by backend services in cloud

Commercial efforts

moving

much faster

than

academia

in both

innovation

and

deployment

Slide5

Slide6

Gartner 2009 Hype Curve

Clouds, Web2.0

Service Oriented Architectures

Transformational

High

Moderate

Low

Cloud Computing

Cloud Web Platforms

Media Tablet

Slide7

Data Centers Clouds & Economies of Scale I

Range in size from “edge” facilities to megascale.

Economies of scale

Approximate costs for a small size center (1K servers) and a larger, 50K server center.

Each data center is

11.5 times

the size of a football field

Technology

Cost in small-sized

Data Center

Cost in Large

Data Center

Ratio

Network

$95 per Mbps/

month

$13 per

Mbps/

month

7.1

Storage

$2.20 per GB/

month

$0.40 per GB/

month

5.7

Administration

~140 servers/

Administrator>1000 Servers/Administrator 7.1

2 Google warehouses of computers on the banks of the Columbia River, in The

Dalles

, Oregon

Such centers use 20MW-200MW

(Future) each with 150 watts per CPU

Save money from large size, positioning with cheap power and access with Internet

Slide8

8

Builds giant data centers with 100,000’s of computers;

~ 200-1000 to a shipping container with Internet access

“Microsoft will cram between 150 and 220 shipping containers filled with data center gear into a new 500,000 square foot Chicago facility. This move marks the most significant, public use of the shipping container systems popularized by the likes of Sun Microsystems and

Rackable

Systems to date.”

Data Centers, Clouds

& Economies of Scale II

Slide9

X as a Service

SaaS: Software as a

Service

imply software capabilities

(programs) have a service (messaging) interfaceApplying systematically reduces system complexity to being linear in number of components

Access via messaging rather than by installing in /usr/binIaaS

:

Infrastructure

as a

Service

or

HaaS

:

Hardware

as a

Service

– get your computer time with a credit card and with a Web interface

PaaS

:

Platform

as a

Service

is IaaS plus core software capabilities on which you build

SaaSCyberinfrastructure is “Research as a Service”

Other Services

Clients

Slide10

Clouds hide Complexity

10

SaaS

: Software as a Service

(e.g. CFD or Search documents/web are services)

IaaS

(

HaaS

): Infrastructure as a Service

(get computer time with a credit card and with a Web interface like EC2)

PaaS

: Platform as a Service

IaaS

plus core software capabilities on which you build

SaaS

(e.g. Azure is a

PaaS

; MapReduce is a Platform)

Cyberinfrastructure

Is “Research as a Service”

Slide11

Geospatial Exampleson Cloud Infrastructure

Image processing and miningSAR Images from Polar Grid (Matlab

)

Apply to 20 TB of data

Can use MapReduceFlood modeling

Chaining flood models over a geographic area. Parameter fits and inversion problems.Deploy Services on Clouds – current models do not need parallelism

Real time GPS processing (QuakeSim)

Services and Brokers (publish subscribe Sensor Aggregators) on clouds

Performance issues not critical

Filter

Slide12

12

Lightweight Cyberinfrastructure to support mobile Data gathering expeditions plus classic central resources (as a cloud)

Slide13

NEEM 2008 Base Station

13

Slide14

Data Sources

Common Themes of Data Sources

Focus on geospatial, environmental data sets

Data from computation and observation.

Rapidly increasing data sizes

Data and data processing pipelines are inseparable.

Slide15

TeraGrid Example: Astrophysics

Science: MHD and star formation; cosmology at galactic scales (6-1500 Mpc) with various components: star formation, radiation diffusion, dark matterApplication:

Enzo

(loosely similar to: GASOLINE, etc.)

Science Users: Norman, Kritsuk (UCSD),

Cen, Ostriker, Wise (Princeton), Abel (Stanford), Burns (Colorado), Bryan (Columbia), O’Shea (Michigan State), Kentucky, Germany, UK, Denmark, etc.

Slide16

TeraGrid Example:

Petascale Climate Simulations

Science: Climate change decision support requires high-resolution, regional climate simulation capabilities, basic model improvements, larger ensemble sizes, longer runs, and new data assimilation capabilities. Opening

petascale

data services to a widening community of end users presents a significant infrastructural challenge.

2008 WMS: We need faster higher resolution models to resolve important features, and better software, data management, analysis,

viz

, and a global VO that can develop models and evaluate

outputs

Applications:

many, including: CCSM (climate system, deep), NRCM (regional climate, deep), WRF (meteorology, deep), NCL/NCO (analysis tools, wide), ESG (data, wide)

Science Users: many, including

both large (

e.g., IPCC, WCRP)

and small groups;

ESG federation

includes >17k users, 230 TB data, 500 journal papers (2 years)

Realistic Antarctic sea-ice coverage generated from century-scale high resolution coupled climate simulation performed on Kraken (John Dennis, NCAR)

Slide17

TeraGrid Example: Genomic Sciences

Science: many, ranging from

de

novo sequence analysis to

resequencing

, including: genome sequencing of a single organism;

metagenomic

studies of entire populations of microbes; study of single base-pair mutations in DNA

Applications: e.g. ANL’s Metagenomics RAST server catering to hundreds of groups, Indiana’s SWIFT aiming to replace BLASTX searches for many bio groups, Maryland’s

CLOUDburst

,

BioLinux

PIs: thousands

of users and developers, e.g. Meyer (ANL), White (U. Maryland), Dong (U. North Texas),

Schork

(Scripps), Nelson, Ye, Tang, Kim (Indiana)

Results of Smith-Waterman distance computation, deterministic annealing clustering, and

Sammon’s

mapping visualization pipeline for 30,000

metagenomics

sequences: (a) 17 clusters for full sample; (

b

) 10 sub-clusters found from purple and green clusters in (a). (Nelson and Ye, Indiana)

Map sequence

clusters to 3D

Slide18

Amazon offers a lot!

Slide19

Philosophy of Clouds and Grids

Clouds are (by definition) commercially supported approach to large scale computingSo we should expect Clouds to replace Compute Grids

Current Grid technology involves “non-commercial” software solutions which are hard to evolve/sustain

Maybe Clouds

~4% IT expenditure 2008 growing to

14% in 2012 (IDC Estimate)Public Clouds are broadly accessible resources like Amazon and Microsoft Azure – powerful but not easy to optimize and perhaps data trust/privacy issues

Private Clouds

run similar software and mechanisms but on “your own computers”

Services

still are correct architecture with either REST (Web 2.0) or Web Services

Clusters

still critical concept

Slide20

MapReduce “File/Data Repository” Parallelism

Instruments

Disks

Map

1

Map

2

Map

3

Reduce

Communication

Map

= (data parallel) computation reading and writing data

Reduce

= Collective/Consolidation phase e.g. forming multiple global sums as in histogram

Portals

/Users

Iterative MapReduce

Map

Map

Map

Map

Reduce

Reduce

Reduce

Slide21

Cloud Computing: Infrastructure and Runtimes

Cloud infrastructure: outsourcing of servers, computing, data, file space, utility computing, etc.Handled through Web services that control virtual machine lifecycles.

Cloud runtimes:

tools (for using clouds) to do data-parallel computations. Apache Hadoop

, Google MapReduce, Microsoft Dryad, and others Designed for information retrieval but are excellent for a wide range of

science data analysis applications

Can also do much traditional parallel computing for data-mining if extended to support

iterative

operations

Not usually on Virtual Machines

Slide22

MapReduce

Implementations support:Splitting of data

Passing the output of map functions to reduce functions

Sorting the inputs to the reduce function based on the intermediate keys

Quality of services

Map(Key, Value)

Reduce(Key, List<Value>)

Data Partitions

Reduce Outputs

A hash function maps the results of the map tasks to r reduce tasks

A parallel Runtime coming from Information Retrieval

Slide23

Sam thought of “drinking” the apple

Sam’s Problem

http://www.slideshare.net/esaliya/mapreduce-in-simple-terms

He used a to cut the and a to make juice.

Slide24

(<a’, > , <o’, > , <p’, > )

Implemented a

parallel

version of his innovation

Creative Sam

Fruits

(<a, > , <o, > , <p, > , …)

Each input to a map is a

list of <key, value> pairs

Each output of slice is a

list of <key, value> pairs

Grouped by key

Each input to a reduce is a <key, value-list> (possibly a list of these, depending on the grouping/hashing mechanism)

e.g. <

ao

, ( …)>

Reduced into a

list of values

The idea of Map Reduce in Data Intensive Computing

A

list of <key, value>

pairs mapped into another

list of <key, value>

pairs which gets grouped by the key and reduced into a

list of values

Slide25

DNA Sequencing Pipeline

Visualization

Plotviz

Blocking

Sequence

alignment

MDS

Dissimilarity

Matrix

N(N-1)/

2 values

FASTA File

N Sequences

Form block

Pairings

Pairwise

clustering

Illumina

/

Solexa

Roche/454 Life Sciences Applied

Biosystems

/

SOLiD

Internet

Read Alignment

~300 million base pairs per day leading to

~3000 sequences per day per instrument

? 500 instruments at ~0.5M

$ each

MapReduce

MPI

Slide26

Cap3 Cost

Slide27

SWG Cost

Slide28

4096 Cap3 data files : 1.06 GB / 1875968 reads (458 readsX4096)..

Following is the cost to process 4096 CAP3 files..

Cost to process 4096 FASTA files (~1GB) on

EC2

(58 minutes)

Amortized compute cost

= 10.41

$

(0.68$

per high CPU extra large instance per hour)

10000 SQS

messages =

0.01 $

Storage per 1GB per month

=

0.15 $

Data transfer out per 1 GB

=

0.15 $

Total

=

10.72

$

Cost to process 4096 FASTA files (~1GB) on

Azure

(59 minutes)

Amortized

compute cost

= 15.10 $

(0.12$

per small instance per hour)

10000

queue messages =

0.01 $

Storage per 1GB per month

=

0.15 $

Data transfer in/out per 1 GB

=0.10

$ + 0.15 $

Total =

15.51

$

Amortized cost in Tempest

(24 core X 32 nodes, 48 GB per node)

= 9.43$

(Assume 70% utilization, write off over 3 years, include support)

Cost of Clouds

Slide29

US Cyberinfrastructure Context

There are a rich set of facilitiesProduction TeraGrid facilities with distributed and shared memoryExperimental “Track 2D” Awards

FutureGrid

: Distributed Systems experiments cf. Grid5000

Keeneland: Powerful GPU Cluster

Gordon: Large (distributed) Shared memory system with SSD aimed at data analysis/visualizationOpen Science Grid

aimed at High Throughput computing and strong campus bridging

29

Slide30

SDSC

TACC

UC/ANL

NCSA

ORNL

PU

IU

PSC

NCAR

Caltech

USC/ISI

UNC/RENCI

UW

Resource Provider (RP)

Software Integration Partner

Grid Infrastructure Group (

UChicago

)

TeraGrid

~2

Petaflops

; over 20

PetaBytes

of storage (disk and tape), over 100 scientific data collections

NICS

LONI

Network Hub

Slide31

TeraGridUser Areas

31

Slide32

80% of Users, 20% of Computing

Nearly 80% of TeraGrid users in FY09 never ran a job larger than 256 cores.Usage by all those users accounted for less than 20% of TeraGrid usage in the same period.96% of users and 66% of usage needed 4,096 or fewer cores.

Slide33

Science Impact Occurs

Throughout the

Branscomb

Pyramid

Slide34

FutureGrid key Concepts I

FutureGrid is a 4 year $15M project with 7 clusters at 5 sites across country with 8 funded partners

FutureGrid is a flexible

testbed

supporting

Computer Science and Computational Science experiments in

Innovation and scientific understanding of

distributed computing

(cloud, grid) and

parallel computing

paradigms

The engineering science of

middleware

that enables these paradigms

The use and drivers of these paradigms by important

applications

The

education

of a new generation of students and workforce on the use of these paradigms and their

applications

interoperability

,

functionality

, performance or evaluation

Slide35

FutureGrid key Concepts II

Rather than loading images onto VM’s, FutureGrid supports Cloud, Grid and Parallel computing

environments by

dynamically provisioning

software as needed onto “bare-metal”

Image library

for MPI,

OpenMP

, Hadoop, Dryad,

gLite

, Unicore, Globus,

Xen

,

ScaleMP

(distributed Shared Memory), Nimbus, Eucalyptus, OpenNebula, KVM, Windows …..

Growth comes from users depositing novel images in library

Each use of FutureGrid is an

experiment

that is

reproducible

Developing

novel software to support these goals which build on Grid5000 in France

Image1

Image2

ImageN

Load

Choose

Run

Slide36

FutureGrid Partners

Indiana University (Architecture, core software, Support)Purdue University

(HTC Hardware)

San Diego Supercomputer Center

at University of California San Diego (INCA, Monitoring)University of Chicago

/Argonne National Labs (Nimbus)University of Florida (ViNE, Education and Outreach)

University of Southern California Information Sciences (Pegasus to manage experiments)

University of Tennessee Knoxville (Benchmarking)

University of Texas at Austin

/Texas Advanced Computing Center (Portal)

University of Virginia (OGF, Advisory Board and allocation)

Center for Information Services and GWT-TUD from

Technische

Universtität

Dresden. (VAMPIR)

Red institutions

have FutureGrid hardware

Slide37

FutureGrid: a Grid/Cloud/HPC Testbed

Private

Public

FG Network

NID

: Network Impairment Device

Slide38

5 Use Types for FutureGrid

Training Education and OutreachSemester and short events; promising for outreachInteroperability test-bedsGrids and Clouds; OGF really needed thisDomain Science applications

Life science highlighted

Computer science

Largest current categoryComputer Systems EvaluationTeraGrid (TIS, TAS, XSEDE), OSG, EGI

38

Slide39

Some Current FutureGrid projects I

Project

Institution

Details

Educational Projects

VSCSE Big Data

IU PTI, Michigan, NCSA and 10 sites

Over 200 students in week Long Virtual School of Computational Science and Engineering on Data Intensive Applications & Technologies

LSU Distributed Scientific Computing Class

LSU

13 students use Eucalyptus and SAGA enhanced version of MapReduce

Topics on Systems: Cloud Computing CS Class

IU SOIC

27 students in class using virtual machines, Twister, Hadoop and Dryad

Interoperability Projects

OGF Standards

Virginia, LSU, Poznan

Interoperability experiments between OGF standard Endpoints

Sky Computing

University of Rennes 1

Over 1000 cores in 6 clusters across Grid’5000

&

FutureGrid using

ViNe

and Nimbus to support Hadoop and BLAST demonstrated at OGF 29 June 2010

Slide40

Some Current FutureGrid projects II

40

Domain Science Application

Projects

Combustion

Cummins

Performance Analysis of codes aimed at engine efficiency and pollution

Cloud Technologies for Bioinformatics Applications

IU PTI

Performance analysis of pleasingly parallel/MapReduce applications on Linux, Windows, Hadoop, Dryad, Amazon, Azure with and without virtual machines

Computer Science Projects

Cumulus

Univ. of Chicago

Open Source Storage Cloud for Science based on Nimbus

Differentiated Leases for IaaS

University of Colorado

Deployment of always-on preemptible VMs to allow support of Condor based on demand volunteer computing

Application Energy Modeling

UCSD/SDSC

Fine-grained DC power measurements on HPC resources and power benchmark system

Evaluation and

TeraGrid/OSG

Support Projects

Use of VM’s in OSG

OSG, Chicago, Indiana

Develop virtual machines to run the services required for the operation of the OSG and

deployment of VM based applications in OSG environments.

TeraGrid QA Test & Debugging

SDSC

Support TeraGrid software Quality Assurance working group

TeraGrid TAS/TIS

Buffalo/Texas

Support of XD Auditing and Insertion functions

Slide41

Education & Outreach on FutureGrid

Build up tutorials on supported softwareSupport development of curricula requiring privileges and

systems destruction capabilities

that are hard on conventional TeraGrid

Offer suite of appliances (customized VM based images) supporting online laboratories

Supporting several workshops including Virtual Summer School on “

Big Data

” July 26-30 2010;

TeraGrid ‘10

“Cloud technologies, data-intensive science and the TG”

August

2010;

CloudCom

conference tutorials Nov 30-Dec 3 2010

Experimental

class use

at Indiana, Florida and LSU

Planning

ADMI

Summer 2011 School on Clouds and REU program for Minority Serving Institutions

Will expand with new hire

Slide42

Software Components

Important as Software is Infrastructure …Portals including “Support” “use FutureGrid” “Outreach”

Monitoring

– INCA, Power (

GreenIT)Experiment

Manager: specify/workflowImage Generation and Repository

Intercloud

Networking

ViNE

Virtual Clusters

built with virtual networks

Performance

library (current tools don’t work on VM’s)

Rain

or

R

untime

A

daptable

Insertio

N Service for imagesSecurity Authentication, Authorization (need to vet images)Expect major open sources software releases this summer of

RAIN (underneath VM’s) and appliance platform (above images)

Slide43

Rain in FutureGrid

43

Slide44

Some critical Concepts as text I

Computational thinking is set up as e-Research and often characterized by a

Data Deluge

from sensors, instruments, simulation results and the

Internet. Curating and managing this data involves digital library

technology and possible new roles for libraries. Interdisciplinary Collaboration

across continents and fields implies

virtual organizations

that are built using

Web 2.0

technology. VO’s link people, computers and data.

Portals

or Gateways provide access to computational and data set up as

Cyberinfrastructure

or e-Infrastructure made up of multiple

Services

Intense computation on individual problems involves

Parallel Computing

linking computers with high performance networks that are packaged as

Clusters

and/or

Supercomputers

. Performance improvements now come from

Multicore architectures implying parallel computing important for commodity applications and machines.44

Slide45

Some critical Concepts as text II

Cyberinfrastructure also involves distributed systems supporting data and people that are naturally distributed as well as pleasingly parallel computations.

Grids

were initial technology approach but these failed to get commercial support and in many cases being replaced by

Clouds.

Clouds are highly cost-effective user friendly approaches to large (~100,000 node) data centers originally pioneered by Web 2.0 applications. They tend to use

Virtualization

technology and offer new

MapReduce

approach

These developments have implications for

Education

as well as

Research

but there is less agreement and success in using cyberinfrastructure in education as with research.

Will Change!

Appliances

” allow one to package a course module (run CFD with MPI) as a download to run on a virtual machine.

Group video conferencing

enables virtual organizations

45