/
OECD Family Database OECD Family Database

OECD Family Database - PDF document

reagan
reagan . @reagan
Follow
345 views
Uploaded On 2021-10-01

OECD Family Database - PPT Presentation

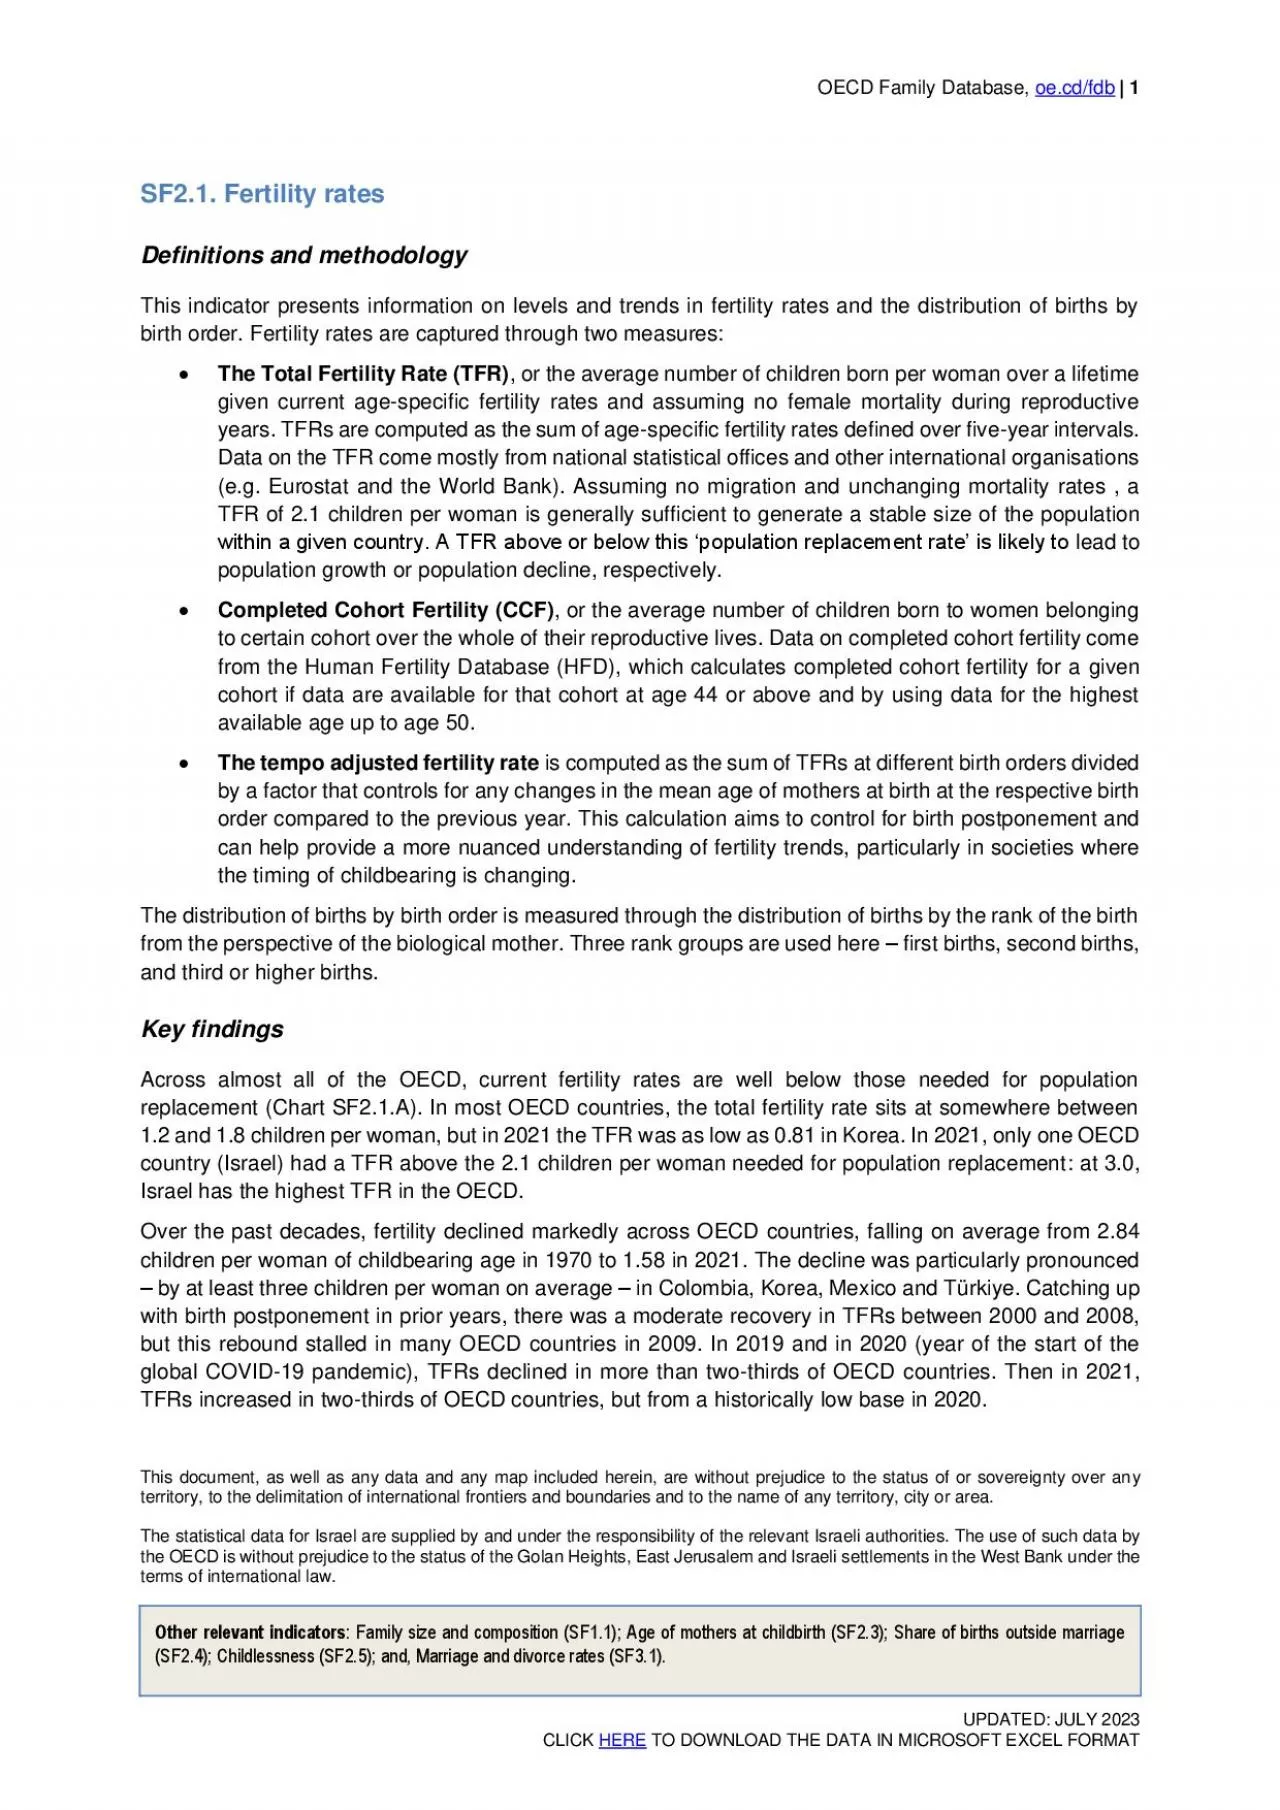
oecdfdb1This document as well as any data and any map included herein are without prejudice to the status of or sovereignty over any territory to the delimitation of international frontiers and bound ID: 892256

births fertility oecd data fertility births data oecd cohort children database rates countries sf2 birth age woman higher completed

Share:

Link:

Embed:

Download Presentation from below link

Download Pdf The PPT/PDF document "OECD Family Database" is the property of its rightful owner. Permission is granted to download and print the materials on this web site for personal, non-commercial use only, and to display it on your personal computer provided you do not modify the materials and that you retain all copyright notices contained in the materials. By downloading content from our website, you accept the terms of this agreement.


Presentation Transcript

1 OECD Family Database , oe.cd/fdb 
OECD Family Database , oe.cd/fdb  1 This document, as well as any data and any map included herein, are without prejudice to the status of or sovereignty over an y territory, to the delimitation of international frontiers and boundaries and to the name of any territory, city or area. T he statistical data for Israel are supplied by and under the responsibility of the relevant Israeli authorities. The use of s uch data by the OECD is without prejudice to the status of the Golan Heights, East Jerusalem and Israeli settlements in the West Ba nk under the terms of international law. Other relevant indicators : Family size and composition (SF1.1); Age of mothers at childbirth (SF2.3); Share of births outside marriage (SF2.4); Childlessness (SF2.5); and, Marriage and divorce rates (SF3.1). UPDATED: JUNE 2021 CLICK HERE TO DOWNLOAD THE DATA I N MICROSOFT EXCEL FO RMAT SF2.1 . Fertility rates Definitions and methodology This indicator presents information on levels and trends in fertility rates and the distribution of births by birth order. Fertility rates are captured through two measures:  The Total Fertility Rate (TFR) , or the average number of children born per woman over a lifetime given current age - specific fertility rates and assuming no female mortality during reproductive years. TFRs are comp uted as the sum of age - specific fertility rates defined over five - year intervals. Data on the TFR come mostly from national statistical offices and other international organisations (e.g. Eurostat and the World Bank). Assuming no migration and that mortali ty rates remain unchanged, a TFR of 2.1 children per woman is generally sufficient to generate a stable size of the population within a given country. A TFR above or below this ‘population replacement rate’ is likely to produce population growth and popula tion decline, respectively.  Completed Cohort Fertility (CCF) , or the average number of children born to women belonging to certain cohort over the whole of their reproductive lives. Data on completed cohort fertility come from the Human Fertility Database (HFD), which calculates completed co

2 hort fertility for a given cohort if da
hort fertility for a given cohort if data are available for that cohort at age 44 or above and by using data for the highest available age up to age 50. The distribution of births by birth order is measured through the distribution of births by the rank of the birth from the perspective of the biological mother. Three rank groups are used here – first births, second births, and third or higher births. Key findings Across almost all of the OECD, current fertility rate s are well below those needed for population replacement (Chart SF2.1.A). In most OECD countries, the total fertility rate sits at somewhere between 1. 3 and 1.9 children per woman, with rates as low as 1. 2 3 in Spain, and just below 1.0 in Korea. Only two OECD countries (Israel and Mexico) have a current TFR at or above the 2.1 children per woman needed for population replacement. At 3. 0 , Israel has the highest TFR in the OECD. Over the past decades, fertility declined markedly across OECD countries, falling on average from 2.8 children per woman of childbearing age in 1970 to 1.6 in 2019. The decline was particularly pronounced – by at least three children per woman on average – in Colombia, Korea, Mexico and Turkey. There was a moderate recovery in average fertility rates between 2000 and 2008, but this rebound stalled in many OECD countries in 2009, probably as a consequence of the global financial crisis. 2020 fertility rates being available only for a few countries, it is st ill too early to measure the full impact of the current COVID - 19 crisis on fertility. Chart SF2.1.A also shows that by 1995, most c ountries had fertility rates well below replacement level. I n many OECD countries TFRs actually increased slightly since the mid - 1990s. In Germany, for example, the current total fertility rate is about 0.3 points higher than in 1995; in the Czech Republic, it is over 0.4 points higher than the 1995 rate. Nonetheless, in most cases, any s uch increases were relatively small and are far from what is required in order to raise fertility to the 2.1 children per woman needed for a stable size of the population.

3 OECD Family Database ,
OECD Family Database , oe.cd/fdb  2 [TYPE HERE] Chart SF2.1.A. Total fertility rate, 1970, 1995 and 201 9 Average number of children born per woman over a lifetime given current age - specific fertility rates and assuming no female mortality during reproductive years Source: Eurostat Database, https://ec.europa.eu/eurostat/data/database ; World Bank World Development Indicators, https://databank.worldbank.org/ ; and national statistical offices. See the accompanying data file ( here ) for detailed sources. OECD Family Database , oe.cd/fdb  3 [TYPE HERE] Data on completed fertility paint a largely similar picture. Chart SF2.1.B shows CCF for women born in 1950, in 1960, and in 1970. For all three birth cohorts, completed fertility is in most countries well below the 2.1 children per woman needed for population replacement. For the 1950 cohort, only the Czech Republic, France, Iceland, the Slovak Republic and Spain have CCF levels above 2.1. For the 1970 cohort, this group falls to just Iceland and the Slovak Republic. CCF also appears to be falling over time – only Denmark, Finland and the United States see CCF increase between the 1950 cohort and the 1970 cohort, with all other countries seeing completed fertility fall between women born in 1950 an d those born in 19 70 . The decreases in Japan (0.5 children per woman) and Spa in (0.7 children per woman) are particularly large. Chart SF2.1.B. Completed cohort fertility for women born in 1950, 1960 and 1970 or latest available Note: Completed cohort fertility is defined as the average number of children born to women belonging to certain cohort over the wh ole of th eir reproductive lives. The Human Fertility Database calculates completed cohort fertility for a given cohort if data are availab le for that cohort at age 44 or above, and by using data for the highest available age up to age 50. See the Human Fertility Da tabase webpage (www.humanfertility.org) for more detail. Data for Bulgaria and the Slovak Republic refer to 1965, for Canada to 1967, for Ic eland and Italy to 1968, an

4 d for France, Germany, and the United Ki
d for France, Germany, and the United Kingdom (England and Wales, Northern Ireland and Sc otland) to 1969. Source: The Human Fertility Database, http://www.humanfertility.org OECD Family Database , oe.cd/fdb  4 [TYPE HERE] Fertility declines are reflected in a fall in the proportion of births that are third or higher births and an increase in the share of births that are first births. Chart CF2.1.C shows the share of births that are the mother’s first birth (panel A) and third or higher birth (panel B) in 1980 and 201 9 . In most of the covered countries, the proportion of births that are the mo ther’s first birth has increased since 1980, while the share of births that are a third or higher birth has fallen. There are some exceptions – in both Estonia and Latvia, for example, the proportion of births that are first births has fallen by over ten p ercentage points since 1980, while the third or higher share has increased by more than eleven and nine percentage points, respectively . For most countries though, third or higher order births are relatively less common today than in 1980, pointing towards a decrease in the frequency of large families. Chart SF2.1.C. Distribution of births by birth order, 1980 and 201 9 Proportion (%) of births that are first and third or higher births a . 2018 instead of 2019. Source: E urostat D atabase, https://ec.europa.eu/eurostat/data/database OECD Family Database , oe.cd/fdb  5 [TYPE HERE] Still, in most countries, first births continue to represent a minority of births (Chart CF2.1.D). First births account for half or more of all of births in only two OECD countries (Luxembourg and Portugal). In all others, the proportion of births that are first births is less than 50%, with the share falling to as low as 3 9 % in Estonia , Ireland and Latvia, and 3 7 % in Turkey . Most remaining births are second births, with third or higher births in most countries making up less than one - in - five births. Cha rt SF2.1.D. Distribution of births by birth order, 201 9 Proportion (%) of births by the rank

5 of the birth a . 2018 instead of 20
of the birth a . 2018 instead of 2019. Source: E urostat D atabase, https://ec.europa.eu/eurostat/data/database Comparability and data issues There are drawbacks to using the TFR to compare trends in fertility as changes in the aggregate can relate to either a cha nge in family size and/or a change in the timing of births. Completed fertility rates can be used to measure the final number of children per women but only when women have reached the end their reproductive life. Changes in the distribution of births by r ank of children also illustrate the changes in fertility patterns, since a reduction of family size is associated with a decrease in the share of higher order births. The distribution of births is, however, also sensitive to timing effects. A closer look a t the timing of births is needed to obtain a more comprehensive view of fertility behaviour and changes over time (SF2.3). Sources and further reading : Eurostat Demographic Statistics, http://ec.europa.eu/eurostat/web/population - demography - migration - projections/births - fertitily - data ; The Human Fertility Database: http://www.humanfertility.org/cgi - bin/main.php ; D’Addio, A.C and Mira d’Ercole, M. (2005), “Trends and Determinants of Fertility Rates in OECD Countries: the Role of Policie s”, OECD Social, Empl oyment and Migration Working Paper, No. 27, Paris; Jasilioniene, A. et al. (2015), Methods Protocol for the Human Fertility Database, http://www.humanfertility.org/Docs/methods.pdf Théveno n, O. (2015), “Decreasing Fertility in Europe: Is it a Policy Issue?” in Koenraad et al. (eds) Population Change in Europe, t he Middle - East and North Africa: Beyound the Demographic Divide, Publisher: Ashgate; Sobotka, T. (2017) “Childlessness in Europe: Reconstructing Long - Term Trends Among Women Born in 1900 – 1972“, in Kreyenfeld, M. and D. Konietzka (eds.), Childlessness in Europe: Contexts, Causes, and Consequences, Springer Demographic Research Monographs, p p. 17 - 50; Jasilioniene, A. et al. (2016), “D ata Resource Profile: The Human Fertility Database“, International Journal of Epidemiology, Online first 23 August 2