/
Department of Biomedical Engineering Department of Biomedical Engineering

Department of Biomedical Engineering - PowerPoint Presentation

risilvia
risilvia . @risilvia
Follow
343 views
Uploaded On 2020-06-16

Department of Biomedical Engineering - PPT Presentation

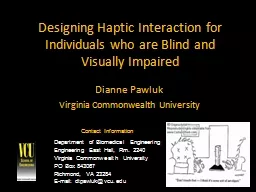
Engineering East Hall Rm 2240 Virginia Commonwealth University PO Box 843067 Richmond VA 23284 Email dtpawlukvcuedu Contact Information Designing Haptic Interaction for Individuals who are Blind and Visually Impaired ID: 778956

designing haptic

Share:

Link:

Embed:

Download Presentation from below link

Download The PPT/PDF document "Department of Biomedical Engineering" is the property of its rightful owner. Permission is granted to download and print the materials on this web site for personal, non-commercial use only, and to display it on your personal computer provided you do not modify the materials and that you retain all copyright notices contained in the materials. By downloading content from our website, you accept the terms of this agreement.


Presentation Transcript

Slide1

Department of Biomedical Engineering Engineering East Hall, Rm. 2240Virginia Commonwealth UniversityPO Box 843067Richmond, VA 23284E-mail: dtpawluk@vcu.edu

Contact Information

Designing Haptic Interaction for Individuals who are Blind and Visually Impaired

Dianne

Pawluk

Virginia Commonwealth University

Slide2

OutlineSimple Motivating ExampleUser PopulationOther IssuesWeaknesses of hapticsStrength of hapticsDesigning for haptics’ strengthsDesigning to avoid haptics’ weaknesses

Summary

Slide3

Motivating Example: Tactile MiceProblems when haptics alone (Rastogi et al., 2009; Jansson et al., 2006, Wall and Brewster, 2006):

Inaccurate position information: - sensitive to path length, speed, mouse orientation, borders

Optical sensor not co-located with position of the pins

- rotation of the mouse not taken into account

With vision,What

problems?

Slide4

Motivating Example: Tactile MiceSolutions:Use a graphics tablet with a stylus in one hand and a stationary tactile mouse in the other hand (e.g., Wall and Brewster, 2006)

Put an RF transmitter to the tablet immediately under the mouse pins

- avoids increased mental load of having to integrate information from two hands (Rastogi et al., 2009)

-

typically a factor of:

10x decrease in translation position errors

20x decrease in rotation errors

Slide5

Degree of Blindness

Low vision: individuals with reduced vision even when using the best possible glasses or contact lens correction available

Totally blind: no light or form perception

Different Effects:Loss of resolution usually bothContrast sensitivity

Degradation of the center of the fieldDegradation of the peripheral field

Degradation of random parts of the field

Variations in the User Population

Low vision

Totally blind

Slide6

Degree of BlindnessDesign Considerations:

Do provide redundant, correlated visual feedback as well as tactile feedbackVisual items/diagrams should provide (Edman, 1992):

Good contrast of color valueColors can be adjusted for individual’s preference

Simplification of the display“Clutter” can be confusingVariations in the User Population

Low vision

Totally blind

Slide7

Variations in the User PopulationMultiple Impairments

Deaf-blindCan span the range of hearing impairment as well as vision

Do not have access to one of the common senses used to substitute for vision – i.e., audition

With tactile impairmentsMany people become blind as a result of diabetes, this can also lead to neuropathy in the peripheral nerves which causes them to lose sensation in the fingers

With cognitive impairmentse.g., TBI

Slide8

Variations in the User PopulationMultiple Impairments

Deaf-blind/Lack of touch-blindDoes suggest that redundantly encoding information both haptically

and with audition would be bestHowever, there may be some benefit to distributing the cognitive load between senses depending on the task

With cognitive impairmentsThe learning process for your system is important for all users

Slide9

Variations in the User Population Using BrailleOnly a small percentage (10%) of individuals who are visually impaired are Braille readers

Experience with Touch

The effects of blindness on the sense of touch is much less clear than for other sensory modalities

(Norman and Bartholomew, 2011):Mixed results for tactile acuity (even with the same method)Mixed results for 2-D raised line drawings3-D shape recognition: those who were blind after having some visual experience seemed to perform the best

With training/experience, individuals who are visually impaired may perceive better with touch – this may only be of benefit for the particular task trained on.

There is an even greater amount of variability between individuals

Slide10

Variations in the User Population

Experience with Touch

One must design for a great variability between individuals, which may not depend on experience

As individuals have a greatly varying amplitude threshold, allowing an amplitude adjustment for individuals may minimize fatigue and adaptation

Slide11

Variations in the User PopulationPrevious Experience with VisionCongenitally blind – blind since birthAdventiously blind – blind later in life

1 year, experience with reaching and movingLater, experience with graphics and words

Possible that those who are adventiously blind have improved performance for raised-line drawings over those who are congenitally blind or sighted (Heller, 1989)

Visual exposure combined with tactile experience are importantHas been suggested that this is due to visually mediation of the picture (e.g., Lederman et al., 1990) but recent work (Behrman and Ewell, 2003) does not support this reasoningThe importance of visual exposure may be due to learning the rules of pictorial representations (Heller, 1989)

Slide12

Variations in the User PopulationPrevious Experience with VisionVisual exposure combined with tactile experience are importantThe importance of visual exposure may be due to learning the rules of pictorial representations (Heller, 1989)

Suggests that having a methodical, rules based representation that can be taught easily would work best

Slide13

Other ConsiderationsUser centered design is crucialA large number of devices/systems for individuals who are blind and visually impaired are rejected by themInteraction with the target population throughout the design process

Cost and portabilityMost individuals who are blind and visually impaired live below the poverty lineReliability and Maintainability

Best to use a universal device as much as possible - both can be crucial to an individual who cannot afford a slow turn around time on fixing the device due to small quantities being made

Slide14

Weaknesses of HapticsLower spatial resolution as compared to visionFor touch: for the fingertips, approximately 1mm (Johnson and Phillips, 1981)for the back, approximately 40mm (Weinstein, 1968)

For vision: for the fovea, 1 arc minute for 20/20 vision or, i.e., approximately 0.15mm from a distance of 0.5m (Wikipedia,, 2012).Approach of Manual Tactile Diagram Makers (Hasty,2012):

Eliminate unnecessary detailsHave multiple diagrams, some of which are enlarged versions of certain parts which one cares about the details

Slide15

Weaknesses of HapticsLimitations when determining geometryDetailed geometry is determined using contour following (Lederman and Klatzky, 1990)

Most likely a limited field of view (i.e., number of fingers that can be used at once) for 2-D graphics

Loomis et al., 1991 – little difference between one and two fingers held together

Jansson and Monaci (2003) – found no difference even when trying to facilitate this by having two fingers track opposite sides of a diagramCraig (1985) – better with one finger than two fingers of the same hand or different hands.Klatkzy et al. (1993) – better with 5 freely moving fingers than 1

Alternately could be due to guided exploration by the remaining fingers

Slide16

Weaknesses of HapticsLimitations when determining geometryContour following with a single finger is a slow, laborious process and is very demanding on higher levels of perceptual processing

Problems with manual raised line drawings:Difficult to determine which line belongs to outside or inside an object part

Difficult to determine which lines are for perspective

Interpreting raised line drawings of common objects is very poor (e.g., Loomis et al., 1991)Unless cued in some way such as by category (Heller et al., 2005), Way and Barner (1997).

Slide17

Strengths of HapticsAvailability of Object Properties: (Klatkzy et al., 1987)

Looked at texture and hardness (material properties); shape and size (geometric)Free sort under haptic unbiased and biased conditions Texture and hardness more salientFree sort under haptics w vision, or haptic w visual bias

Shape (and to some extent size for haptics w vision) more salient

Texture and hardness more salient than shape and size for unbiased haptics

Slide18

Strengths of HapticsAvailability of Object PropertiesModeling the exploratory procedures to extract them

(Klatkzy and Lederman, 1993)

The exploratory procedures that are used under unbiased haptic encoding

are generally found to be rapid and accurate

Slide19

Strengths of HapticsAvailability of Object Properties (Lederman and Klatzky, 1997)

Task: search for a target amongst distractor objects

Apparatus

Rough

vs

Smooth Left vs

Right Planar Orientation

E.g., of parallel E.g., of serial

Slide20

Strengths of HapticsAvailability of Object Properties (Lederman and Klatzky, 1997)

Material properties and abrupt discontinuities are processed earlier and in parallel, as compared to detailed shape information

Most in parallel

material properties

abrupt

discontinuities

detailed shape

Most serial

The “one-time” processing component was significantly more for detailed shape too.

Intensive

Spatial

Slide21

Strengths of HapticsAvailability of Object Properties (Lederman and Klatzky, 1997)

Caveat: for more difficult discriminations => becomes more serial in nature, one-time processing increases

Difficult, in terms of

ratio of spacing between

dots

2:1 4:1

How easy it is to discriminate your items will affect performance!

Slide22

Haptic Exploration of 3-D ShapeLakatos and Marks, 1999

In the beginning, use distinguishing local features (like sharp points or deep surface occlusions) more to determine similarity

Later, uses more global shape to determine similarityPlaisier

et al., 2009 Edges and vertices were most salient Performance did not depend on the number of themWe have similarly noticed for raised line drawings on a tactile display: participants will look for easily

discriminable features first

they will only explore more globally if the first method doesn’t work

If possible, use distinguishing local features to discriminate objects/icons

Slide23

Designing for Haptic’s StrengthsMaterial Properties:

Lessons From Manually Created Diagrams (Edman, 1992)

Raised line diagrams

Serially processing so….Difficult to determine partsWhich lines are perspective

Tactile experience pictures

Solid textures delineate partsPotential parallel processing

Much more effective than raised

line drawings

Slide24

Designing for Haptic’s Strengths

Material Properties:

Encoding Information with Texture (Thompson et al., 2006)

Slide25

Material Properties: Encoding Information with Texture (Thompson et al., 2006)

Limitations:

- Cannot distinguish different parts and 3-D orientation at the same

time

- Did not investigate on how this impacted performance with

varying number of fingers (used 5 fingers always)

Designing for

Haptic’s

Strengths

Slide26

Designing for Haptic’s StrengthsMaterial Properties: Using texture to encode information on a haptic display (Burch &

Pawluk, 2011)

(A) the pinhole aperture;

(B) the RGB sensor; (C) pushbutton switch; and (D) piezoelectric actuator

Three finger display

Scanning over a computer

monitor

Slide27

Designing for Haptic’s Strengths“Texture” Set Chosen: (Burch and Pawluk

, submitted a,b)

Determined through extensive evaluationTemporal frequencies (12, 25 and 50 Hz) to represent separate parts

Spatial frequency modulation of the temporal frequency and a 100 Hz square wave With orientations of horizontal, vertical, diagonal and none to represent part orientation94% accuracy of identifying parts, 90% accuracy identifying part orientation

Selection of Texture Set

Wanted two dimensions1

st

dimension separate into parts (at least 3 distinct values)

2

nd

dimension part orientation (horizontal, vertical, curved, unspecified)

High saliency/discrimination is necessary to:

Processing information quickly and easily

Potentially lead to parallel processing (at least for search tasks)

Slide28

Designing for Haptic’s StrengthsExperiment Using texture to encode information on a haptic display (Burch and

Pawluk, 2011)

Two factors:Raised line or texture representationsOne finger or three fingers

Asked to identify common objects from one of four (equalized) sets of 8 objects for each conditionRecorded answer and exploration time7 participants: (3) totally blind, (4) visually impaired

Hypotheses:Improved accuracy from one finger raised-line to one finger textured due to enriched representation; times will both be long due to serial nature of processing information

2. Improved accuracy and shorter time from one finger textured to three fingers textured due to parallel processing

3. No improvement from one finger raised line to three fingers raised line (only detailed geometry)

Slide29

Designing for Haptic’s StrengthsResults:

Significant difference between 1 and 3 fingered textured graphics

No difference between 1 and 3 fingers raised line graphics

Nominal difference between 1 finger raised line and 1 finger texturedSuggests parallel processing occurred for texture even though not a search taskResults with POINT CONTACT displays approach that of Thompson et al.

Slide30

Designing to Overcome Haptic’s WeaknessesLower spatial resolution as compared to visionApproach of Manual Tactile Diagram Makers (Hasty,2012):Eliminate unnecessary details

Have multiple diagrams, some of which are enlarged versions of certain parts which one cares about the detailsDesign Solutions:Eliminate unnecessary details

Provide a zoom function that is available on-demand

Allows user to: - have independent access to all information - active control

Slide31

Designing to Overcome Haptic’s WeaknessesZooming:Walker and Salisbury (2003) – smooth zooming, with force feedback “detents”Magnuson and Rassmus-Grohn

(2003 – logarithmic step zoomingZiat et al. (2007) – linear step zooming

The first two studies implemented panningMagnuson and Rassmus-Grohn

(2003) looked at:Pressing on the edge (limit box) to scrollArrow keysDrag surprisingly the Arrow keys were liked the best (but note: only one participant blind of the six)

Slide32

Designing to Overcome Haptic’s WeaknessesZooming: Potential New Weakness with Haptics OnlySerial nature of tactile processing

Determining appropriate zoom levelsCannot take a quick glance as in vision, must process info seriallyChosen level may not reveal new detailMay not be any further detail to look at

Wijntjes and his colleagues (2008) also showed better identification rates with larger pictures even when smaller pictures are perceptible

Mean Accuracy: 0.84 cf. 0.77, Mean Response Latency: 51 cf. 47 secDisplays may be croppedCannot easily infer that are cropped as no parallel processingHow much to pan?

Slide33

Designing to Overcome Haptic’s Weaknesses“Intelligent Zooming”Schmitz and Ertl

(2010) with street mapsBasic zooming stepsall streets, remove residential road, remove all road and leave towns or suburbsFound no fixed zooming levels were effective to deal with “clutter”

Instead based on the density of streets, main streets or suburbs in the observed regionNo clear results on use (also small sample size, between factor)

Rastogi and Pawluk (submitted) with picturesNavigate zoom levels based on relational grouping of objectsScale object/sub-object to optimally fit display area

Slide34

Designing to Overcome Haptic’s Weaknesses Rastogi and Pawluk

Navigate zoom levels based on relational grouping of objects

Scale object/object part to optimally fit display area

If no object/object part, do not zoom, give feedbackObject close together are considered a meaningful cognitive component

Slide35

Designing to Overcome Haptic’s Weaknesses Comparison to Logarithmic and Linear Step Zooming

Haptic Device

Tablet

What type of roof does the house have?

How are the windows oriented?

Is there a door in the house?

Which side of house is the plant located?

How many petals are there on the flower?

Example Diagram

Slide36

Designing to Overcome Haptic’s Weaknesses Comparison to Logarithmic and Linear Step Zooming

Experimental Design17 individuals who were blind or visually impairedEach participant were presented with all 3 methods counterbalanced in presentation order

6 diagrams, 2 each per condition, counterbalanced across conditions Response variables: number of correct answers

time taken per question system usability survey (Brooke, 1986)

Slide37

Comparison to Logarithmic and Linear Step Zooming

“Intuitive” zooming holds potential for improvements when using pictures

Designing to Overcome

Haptic’s Weaknesses

*SE = Standard Error, CI = Confidence Interval

Slide38

Designing to Overcome Haptic’s WeaknessesLimitations in Processing GeometryApproach of Manual Tactile Diagram Makers (Hasty,2012):Simplify boundaries

Eliminate unnecessary detail for the task at hand Both are designed to avoid overwhelming the user with information

Design Solutions:Can do the above dynamically

Allows user to: - have independent access to all information as they need it - don’t have to feel it all at once - active control

Slide39

Designing to Overcome Haptic’s WeaknessesLimitations in Processing GeometryExploration of different types of simplification for tactile diagrams (Ravi and Pawluk

, submitted) Experiments designed to examine the potential usefulness of:

Boundary simplification

Observation: - straight lines are easier to track than convoluted lines and likely easier to process as well - more details may be necessary for some

queries

Contextual simplificationDynamically remove content not needed for that instance

Similar to visual “filter” and “relate” (Dykes et al., 2005)

Slide40

Designing to Overcome Haptic’s WeaknessesExperimentsUsed geographical maps for their complexity and frequency of use

Imaginary countries were used to avoid biasUsed the tactile device shown previouslyPresented diagrams with no simplification and the specific type of simplification to assess performance differences

Recorded: accuracy of answers, time needed, perception of difficulty and confidence in use

8 participants who were blind or visually impaired

Slide41

Designing to Overcome Haptic’s Weaknesses Questions Asked: 1) General shape of country 2) Number of states

Is Boundary Simplification Helpful?

Helpful for shape identification but not for number of states

Difficulty

and Confidence differences were statistically significant

Slide42

Designing to Overcome Haptic’s WeaknessesIs Contextual Simplification Helpful?

Alternatives:

- Whole map or - Only relevant feature sets for questions

Feature sets: Boundaries (country and state)Political features (cities and roads)Physical features (water bodies, mountains and forests)Industrial features (coal mines and oil fields)

Slide43

Designing to Overcome Haptic’s WeaknessesIs Contextual Simplification Helpful?

Helpful for answering the context dependent questions, not for number of states

Other response variables were not statistically significant

Slide44

SummaryDesigning a display for haptics alone vs. haptics + vision can lead to different approachesHaptic’s strength is in processing material properties and abrupt discontinuities (both 2-D and 3-D)It is both fast and can be done in parallel if discrimination is easy

Can lead to greatly improved performance of displays May not see an improvement with multiple fingers otherwise

Haptic’s weaknessesLower spatial resolution than vision

Slow, serial, memory intensive processing of processing detailed geometryDynamic computing environments have the potential to manage the effects of these weaknesses for more effectively