/
Analysis Process  (DLA) : Analysis Process  (DLA) :

Analysis Process (DLA) : - PowerPoint Presentation

rose
rose . @rose
Follow
65 views
Uploaded On 2023-09-25

Analysis Process (DLA) : - PPT Presentation

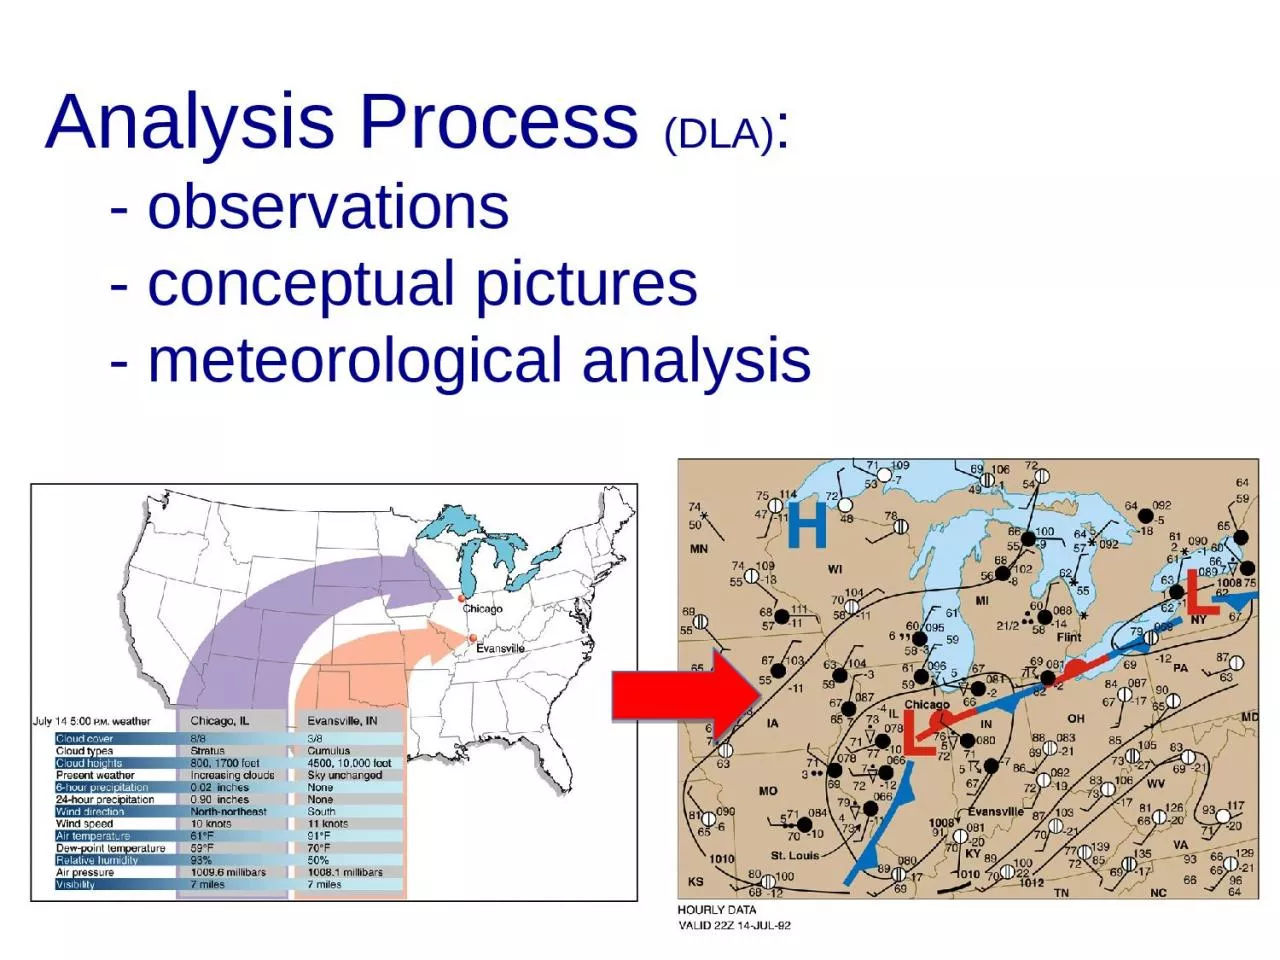
observations conceptual pictures meteorological analysis Observations Conceptual Picture Analysis Definitions air masses fronts Frontal Identification 1 Temperature 2 Humidity ID: 1021022

weather surface fig analysis surface weather analysis fig dla observations meteorological processes atmosphere wind met anal features measurements patterns

Share:

Link:

Embed:

Download Presentation from below link

Download Presentation The PPT/PDF document "Analysis Process (DLA) :" is the property of its rightful owner. Permission is granted to download and print the materials on this web site for personal, non-commercial use only, and to display it on your personal computer provided you do not modify the materials and that you retain all copyright notices contained in the materials. By downloading content from our website, you accept the terms of this agreement.


Presentation Transcript

1. Analysis Process (DLA): - observations - conceptual pictures - meteorological analysis

2. +=ObservationsConceptual PictureAnalysis

3. * Definitions (air masses, fronts)* Frontal Identification

4. 1. Temperature2. Humidity3. Wind Shift4. Pressure Tend.5. Clouds/Precip.

5. Observing Systems (2):Infra-red (IR) 10.5-12.5 umtemperature

6. Time Zones

7. Weather Station ModelMiles/hr * 0.87 = knotsMeters/s * 1.94 = knotsCurrent Weather Plots

8. Note: Direction is From not Towardswesterlyeasterlysoutherlynortherly

9.

10. Fri 06Z IsobarsLines of constant Pressure

11. Table of common isoplethsIsobar PressureHeight Isohypse (Heights)Isotherm TemperatureIsotach Wind SpeedIsogon Wind DirectionIsoshear Wind ShearIsodrosotherm Dew pointIsohyet Precipitation Accumulation Isohaline Salinity Isohume HumidityIsoneph Cloudiness

12.

13. Surface High clockwise rotation (Anticyclonic)Surface Low counter-clockwise rotation (Cyclonic)Buys Ballot’s lawNorthern Hemisphere

14.

15. AK(AK) Fig. 1-13, p. 15A change of 1mb with elevation is approximately ~ 10 meters change near the surface.

16. Media content?All three maps are for the same day

17. Illustrative Example: July 14, 1992(DLA Chapter 1)How to combine meteorological data (weather observations, satellite, radar) and an understanding of atmospheric dynamics to create a cohesive picture of current weather

18. Figure 1.1Weather in Chicago, Evansville

19. Weather Map Plotting SymbolsDLA Fig. 1.12

20. Station Plots of Weather Conditions – No Analysis InvolvedDLA Fig. 1.13

21. Surface Weather MapSurface measurements plus analyzed surface pressure contours and H and L for highs and lows based on surface measurements.DLA Fig. 1.14

22. Divergence and ConvergenceDIVERGENCE

23. Basic Circulation ModelKnowledge of 3-dimensional and time-varying patterns and processes helps us make sense of --- and thereby better analyze--- surface, satellite, and radar observations.DLA Fig. 1.16

24. Frontal Cyclone FeaturesKnowledge of 3-dimensional and time-varying patterns and processes helps us make sense of --- and thereby better analyze--- surface, satellite, and radar observations.DLA Fig. 1.19

25. Measured Versus Calculated VariablesGFS 500 hPa Winds00Z 18 July, 2013 Analysis

26. Measured Versus Calculated VariablesGFS 500 hPa Absolute Vorticity00Z 18 July, 2013 Analysis

27. Satellite Image of 22 Z WeatherSatellite based measurements of EM radiation from Earth are used to infer conditions at and above the surface. These contribute to surface analysis. DLA Fig. 1.17a

28. Weather Radar Image for 22 Z Ground based measurements of radio frequency scattering and reflection within atmosphere are used to infer conditions at and above the surface. These contribute to surface analysis. DLA Fig. 1.17b

29. Measured Versus Calculated VariablesTEMPERATUREADVECTION51015COLDWARMCO LDAD VWA RM AD VH Fig. 6.12500 mb1000 mb

30. The 22 Z Surface Weather MapResulting surface weather map in which analyzed features have been included based on: (a) surface and non-surface sensors: and (b) analyst’s knowledge of patterns and processes. DLA Fig. 1.18

31. What is meteorological analysis and why do we do it?Met anal is a set of processes for inferring atmospheric features from observations that do not themselves directly describe the features of interest. See also the definitions of analysis and reanalysis in the Glossary of Meteorology.For example, inferring:wind at a point from nearby windscloud level from temperature (T) sounding c. winds from pressures d. positions of highs and lows from winds e. positions of fronts from T and windsTo do good met anal, you need a good practical understanding of: a. observation systems ** b. spatial and temporal patterns ** c. relationships and processes ** (including the equations that describe the relationships and processes) d. data assimilation systems e. models ** indicates issues we’ll explore in this course

32. What is meteorological analysis and why do we do it? (continued)Met anal is essential to: a. describing the state of the atmosphere b. predicting future atmospheric statesAnalyzing the atmosphere is not the same as forecasting the atmosphere, but it forms the foundation for making forecasts.Met anal is necessary because:we don’t have adequate observations of the environment not all features of interest can be directly measuredwe need good descriptions of the atmosphere (i.e., good analyses) in order to give forecasting systems the best possible starting points

33. Central Role of Meteorological AnalysisObservationsAnalysesForecasts

34. Central Role of Meteorological AnalysisObservationsAnalysesForecastsResearchOperations

35. Weather Maps

36.

37.

38. Lets Look at some Weatherhttp://met.nps.edu/~ldm/wx/