/
1 Gili Shark Conservation Project Gili Air Indonesia 1 Gili Shark Conservation Project Gili Air Indonesia

1 Gili Shark Conservation Project Gili Air Indonesia - PDF document

ruby
ruby . @ruby
Follow
342 views
Uploaded On 2021-09-15

1 Gili Shark Conservation Project Gili Air Indonesia - PPT Presentation

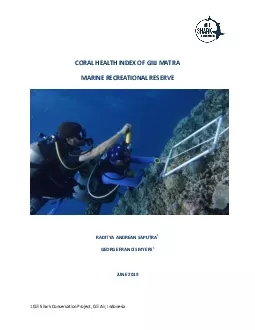
CORAL HEALTH INDEX OF GILI MATRAMARINE RECREATIONAL RESERVERADITYA ANDREAN SAPUTRA1GEORGE FRANCIS MYERS1JUNE20191SummaryThe current study reports the findings of an extensive coral reef health survey ID: 881201

reef coral high fish coral reef fish high health gmmrr chi figure benthic sites reefs cover biomass recovery potential

Share:

Link:

Embed:

Download Presentation from below link

Download Pdf The PPT/PDF document "1 Gili Shark Conservation Project Gili A..." is the property of its rightful owner. Permission is granted to download and print the materials on this web site for personal, non-commercial use only, and to display it on your personal computer provided you do not modify the materials and that you retain all copyright notices contained in the materials. By downloading content from our website, you accept the terms of this agreement.


Presentation Transcript

1 1 Gili Shark Conservation Project, Gili
1 Gili Shark Conservation Project, Gili Air, Indonesia CORAL HEALTH INDEX OF GILI MATRA MARINE RECREATIONAL RESERVE RADITYA ANDREAN SAPUTRA 1 GEORGE FRANCIS MYERS 1 JUNE 2019 1 Summary The current study reports the findings of an extensive coral reef health survey conducted in the Gili Matra Marine Recreational Reserve (GMMRR), providing a valuable measurement for the long - term monitoring of these reefs. Using the Cora l Health Index (CHI) protocol of Giyanto et al. (2017), which is widely used throughout Indonesia, the current study reports that the majority of dive sites within the GMMRR have a CHI score of 3/10, indicating low reef health. Compared with the index scor es calculated in 2014 (Giyanto et al. 2017), it is evident that the health of the reef at Turtle City has severely declined, with the CHI score dropping from 6 to 3. The reef health has also declined, although less severely at Halik and Shark Point. The on ly site at which the CHI score has increased, is Sunset Point, increasing from 2 to 3. The benthic community is dominated by dead coral smoth

2 ered in algae (38.4% ± 3.4 SE). Hard cor
ered in algae (38.4% ± 3.4 SE). Hard coral constitutes 20.4% ±2.8 SE of the reef, and sponges constitute 16.6% ±3.9 SE. The benthic community has a low percentage cover of soft coral 4.4% ±1.3 SE and fleshy seaweed 0.1% ±0.1 SE. The biomass of target fish families throughout the GMMRR was classified as low, ranging from 17kg/ha ±7.4 SE at Turtle City, to 129kg/ha ±20.1 SE at Shallow Turbo. Introduction Coral reefs provide a crucial foundation for numerous ecological, social and economic systems. Not only are they a vital ecological resource for over 25% of all marine species, a physical barrier that protects coastlines from storm damage, a natural phenomenon with immeasurable social value and their worth is an estimated $29.8 billion annually to the global economy (Spalding et al., 2001; Cesar, Burke and Pet - Soede, 2003). This is particularly true for the coral reefs of the GMMRR, which are a major source of tourist income, coastal protection and food supply. Unfortunately, these reefs have shown signs of degradation through a combination of threats such as; overfishing, pollution

3 and bleaching events (Bakti et al., 20
and bleaching events (Bakti et al., 2012 ). The protection of these coral reefs and their resources relies upon effective management, which is itself dependent upon the availability of sufficient data to increase our understanding of the health of these reefs. The current report details the findi ngs of a comprehensive ongoing study conducted from monitoring 10 sites within the GMMRR from January 2019 – April 2019. This study was completed in adherence to the COREMAP - CTI Coral Health Index (CHI); a national monitoring guideline that is applied thro ughout Indonesia, allowing data at various spatial and temporal scales to be 2 comparable. This is extremely valuable in its ability to highlight how reef health is changing spatially and temporally, thus providing an insight into where and how management ac tions would be best applied. The current study uses an index for coral reef health (Figure 1) that constitutes a variety of parameters; Benthic recent condition, benthic recovery potential, and fish biomass. Thus allowing the index to provide a more accura te measurement of reef

4 health, rather than provided by a singl
health, rather than provided by a single parameter such as coral cover. Figure 1. The parameters used to determine CHI. ( Giyanto et al., 2017). The value of the benthic component of the CHI, focuses on two factors: the recent con dition and the recovery potential (Table 1). The recent condition is defined by the live coral cover percentage, which is categorized as either high, medium or low. The recovery potential represents the ability of the reef to recover from disturbance. This is defined according to the cover percentage of two variables, which are negatively associated with coral reef recovery, fleshy seaweed and coral rubble. The recovery potential of a reef is defined as high if it meets the following two conditions: 1. Fle shy seaweed cover is less than 3%. 2. Rubble cover is less than 60% or live coral cover is more than 5%. The value of the benthic component is then determined by combining the live coral cover percentage and recovery potential values. 3 T able 1. Benthic component value ( Giyanto et al., 2017) LIVE CORAL COVER RECOVERY

5 POTENTIAL BENTHIC CATEGORY VALUE OF
POTENTIAL BENTHIC CATEGORY VALUE OF BENTHIC COMPONENT High High Good reef with high recovery potential 6 High Low Good reef with low recovery potential 4 Medium High Moderate reef with high recovery potential 5 Medium Low Moderate reef with low recovery potential 2 Low High Poor reef with high recovery potential 3 Low Low Poor reef with low recovery potential 1 The fish component of the CHI, is a measure of the biomass of selected fish species. This is divided into three categories; high, medium or low . The current study estimated the biomass of the selected fish families; Snapper, Grouper, Parrotfish, Rabbitfish , Surgeonfish and Butterflyfish. By comparing their length measurements to known length:biomass ratios (Froese et al., 2013). The CHI value is then determined by combining the values of the benthic component and the fish component as shown in Table 2. The se values are ranked from 1 (lowest coral reef health) to 10 (highest coral reef health). Table 2. Combination of benthic and f ish component making up the CHI ( Giya

6 nto et al., 2017) BENTHIC COMPONENT
nto et al., 2017) BENTHIC COMPONENT FISH COMPONENT TOTAL VALUE CORAL HEALTH INDEX Live cor al cover Recovery potential Value Fish biomass Value High High 6 High 6 12 10 High High 6 Medium 4 10 8 High High 6 Low 2 8 6 Medium High 5 High 6 11 9 Medium High 5 Medium 4 9 7 Medium High 5 Low 2 7 5 4 High Low 4 High 6 10 8 High Low 4 Medium 4 8 6 High Low 4 Low 2 6 4 Low High 3 High 6 9 7 Low High 3 Medium 4 7 5 Low High 3 Low 2 5 3 Medium Low 2 High 6 8 6 Medium Low 2 Medium 4 6 4 Medium Low 2 Low 2 4 2 Low Low 1 High 6 7 5 Low Low 1 Medium 4 5 3 Low Low 1 Low 2 3 1 Methodology Study site The current study was conducted on the reefs of the Gili Matra archipelago (8°21’S; 116°4’E), which consists of three islands; Gili Air, Gili Meno and Gili Trawangan. Located on the north west coast of Lombok, Indonesia (Figure 2).

7 The three isl ands are a popular tourist
The three isl ands are a popular tourist destination, attracting many travellers from the neighboring islands of Bali and Lombok. All data was collected from January 2019 – April 2019 via SCUBA at a depth less than 10 meters. Average sea surface temperature was 28°C, wi th visibility ranging from 5 - 30 meters. 5 Figure 2. The GMMRR consists of three islands off the north east coast of Lombok, Indonesia Sampling design Underwater Photo Transect (UPT) methodology was used to measure the benthic community composition at 11 sites in the GMMRR at a depth less than 10m. Measurements were replicated three times at each site. At each site, a 50m transect was laid parallel to the shore and a quadrat was placed on the reef at the 0 m mark. Using an underwater camera, a photo was the n taken of the quadrat perpendicular to the reef and at a distance of 1m. Using the exact same technique photos were taken at each meter of transect, providing 50 photos for each transect, and thus representing 50m 2 of reef. At the end of the transect afte r the final photo taken, divers waited 5

8 minutes for the fish to acclimatize to
minutes for the fish to acclimatize to their presence. Then proceeded to conduct an Underwater Visual Census (UVC) to measure the fish biomass and diversity. Divers swam back along the transect recording the occurre nces and estimated 6 the total fish length of the targeted fish families that were present within 2.5m either side of transect. Each UVC represents 250m 2 of reef. Data analysis Coral Point Count with Excel extension (CPCe) software version 4.1 was used to a nalyze the photos taken from each UPT (Figure 3). In CPCe, benthic categories were identified using ‘KODE KARANG COREMAP’ classification. A total of 30 random points were used for analyzing each image, thus cover percentage of benthic categories was quanti fied. Fish component data was analyzed using Microsoft Excel software. Abundance, biomass, and diversity of the six targeted families, were determined by summing up the number of species per family sighted, converting length to biomass of each species sigh ted and finally, calculating the number of individual species per family. The cover percentage of b

9 enthic categories and fish biomass were
enthic categories and fish biomass were then used to generate the Coral Health Index (CHI) as outlined by Giyanto et al . (2017). Figure 3. Screenshot o f C PCe during UPT data analysis 7 Results Coral Health Index Within the GMMRR the majority of dive sites had a CHI of 3 (Figure 4). The healthiest sites were Halik (6), Shark Point (5) and Sunset Point (5). With comparison to the CHI scores calculated in 2014, by Giyanto et al. (2017), it is evident that the health of the reef at Turtle City has severely declined with the CHI score dropping from 6 to 3 (Figure 5). The reef health has also declined, although less severely, at Halik and Shark Point. The only site at which the CHI score has increased, is Sunset Point, going from 2 to 3. The 2014 survey only indexed 6 of these sites, therefore the current study provides a valuable baseline measurement for the health of the following four dive sites: Bounty Wreck, Sha llow Turbo, Statue Garden and Meno Wall. Figure 4. CHI scores of 10 dive sites within the GMMRR. 4 of these sites, marked with a star – Bounty Wreck, Shal

10 low Turbo, Statue Garden and Meno Wall
low Turbo, Statue Garden and Meno Wall – have not been indexed before, and thus these scores provid e a valuable baseline measurement. 8 Figure 5. CHI scores of 10 dive sites within the GMMRR, compared with the scores calculated by Giyanto et al. in 2014. Benthic community The benthic cover within the GMMRR is dominated by dead coral smothered in algae, 38.4% ± 3.4 SE (Figure 6). Hard coral constituted 20.4% ±2.8 SE of the reef and sponges constituted 16.6% ±3.9 SE. The benthic community has a low percentage cover of soft coral 4.4% ±1.3 SE and fleshy seaweed 0.1% ±0.1 SE. Figure 7 is showing example of t wo UPT dominated by dead coral with algae and hard coral as the most dominant substrate in the GMMRR. 9 Figure 6. Benthic community composition, averaged across all dive sites within the GMMRR There was notable variation between dive sites in their percen tage cover of hard coral (Figure 8). The highest cover was found at Halik 37.8% ±4.6 SE, Shark Point 31.4% ±9.9 SE and Statue Garden 32.1% ±3.2 SE. The hard coral cover at the other sites ranged from 11.5% ±3.6

11 SE to 18.1% ±3.1 SE. Figure 7. T
SE to 18.1% ±3.1 SE. Figure 7. Two domin ant categories of substrate: dead coral with algae (left) and hard coral (right) in GMMRR. 10 Figure 8. Percentage of hard coral cov er at 10 sites within the GMMRR Fish community The density of the targeted fish families (Snapper, Grouper, Parrotfish, Rabbitfish, Surgeonfish, Butterflyfish) ranged from 42.0 ±14.0 SE at Sunset Point to 121.7 ±40.9 SE at Turtle City. The density of butterflyfish, which are considered a reliable indicator of reef health (Hourigan, Timothy, Reese., 1988), was highest at Hal ik, which is consistent with the current study’s CHI index scores. Interestingly, the biomass of the target fish families was lowest at Turtle City 17.3kg/ha ±7.4, and highest at Shallow Turbo 129.1kg/ha ±20.1 (Fi gure 10). Across all dive sites, t here was a large variation in fish density between the target fish families, with a notably low density of Snappers, Groupers, Rabbitfish and Parrotfish relative to Butterflyfish and Surgeonfish (Figure 11). The most common fish was the Lined Bristtletooth ,

12 Ctenochaetus striatus from the Surge
Ctenochaetus striatus from the Surgeonfish family (Figure 9) and the least common fish were from the Snapper family. 11 Figure 9. Lined Bristtletooth, C. striatus as t he most abundant fish species ( IUCN Red List of Threatened Species, 2019) Figure 10. B iomass (kg/ha) and density (number of individuals) of target fish families (Snapper, Grouper, Parrotfish, Rabbitfish, Surgeonfish, Butterflyfish) at 10 sites with in the GMMRR 12 Figure 11 . Density of the six target fish families, averaged across all dive s ites within the GMMRR. Discussion Coral Health Index Not only should a healthy reef have a high live coral cover, but they should be resilient against disturbance and sustain an abundant population of commercially valuable reef fish. These parameters enge nder an index that not only reflects the current state of the reef, but also encompasses the recovery potential and the economic/ecological value of the reef. The coral reef health index constitutes a selection of such parameters which provide a holistic m easure of reef health. Across all dive s

13 ites within the GMMRR, the average CHI s
ites within the GMMRR, the average CHI score is 3.7, which suggests “low - medium” reef health on the CHI scale of 1 to 10. According to these CHI scores, the healthiest sites within the GMMRR are Halik (6), Shark Poin t (5) and Statue Garden (5). With respect to the zonation of the GMMRR, it appears that the three healthiest reefs all exist within ‘No Fishing’ zones (Figure 1 2 ). However, it must be noted that the higher health of these reefs may not necessarily be attri butable to the protection 0 10 20 30 40 50 60 Butterflyfish Surgeonfish Rabbitfish Parrotfish Grouper Snapper fish density Fish Family Average density of target fish families 13 status of their zone. For these reefs may have been prescribed protection because they were already the healthiest reefs when the zones were being decided. Nevertheless, the value of no - take zones for the conservation of reef heal th is well documented and therefore we can assume it has a role to play in the increased health of the reefs in the ‘No Fishing’ zones in the GMMRR. 14 Figure 1 2 . CHI

14 value overla id on top of GMMRR zonatio
value overla id on top of GMMRR zonation map With comparison to the CHI scores collected in 2014, reported by Giyanto et al. (2017), it is evident that over the past 5 years there have been marked changes in reef health within the GMMRR (Fig. 6). Halik has dropped from 7 to 6, Shark Point has dropped from 6 to 5, and the most concerning Turtle City has fallen from 6 to 3. The only dive site at which the CHI score has increased, is Sunset Point, moving from 2 to 3. This decline in reef health could be attributed to many factors, including those on a gl obal scale such as increased sea surface temperature and those on a local scale, such as overharvesting. Human development on the Gili islands has increased significantly over the past 5 years, with an associated increase in pollution, boat traffic and fis hing pressure. This, combined with the increased frequency of bleaching events noticed worldwide, could help to explain the reported changes in reef health within the GMMRR. 15 Benthic cover The benthic community within the GMMRR is dominated by dead coral wh ich has been smo

15 thered in algae (38.4% ± 3.4 SE), follo
thered in algae (38.4% ± 3.4 SE), followed by live hard coral (20.4% ±2.8 SE) and sponge (16.6% ±3.9 SE). Other biota such as soft coral and seaweed are at low abundance (5%) (Fig. 7). The relatively high abundance of dead coral indicates high coral mortality, which could itself be attributable to a variety of abiotic factors such as; sedimentation, pollution, storms, bleaching and boat anchor damage. Also biotic factors such as ; disease and reduced herbivores . It is unclear which factors a re most to blame; however it is likely that numerous factors are involved, perhaps at different spatial and temporal scales. Fish abundance, biomass, and diversity The biomass of the targeted fish families (Snapper, Grouper, Parrotfish, Rabbitfish, Surgeon fish, Butterflyfish) is classified as “low” across all dive sites within the GMMRR, ranging from 17.3kg/ha ±7.4 at Turtle City, to 129.1kg/ha ±20.1 at Shallow Turbo (Fig. 9). At some dive sites, the most notable example being Turtle City, there was a marke d difference between fish biomass and density. Turtle City has the lowest fish bioma

16 ss yet the highest fish density, of all
ss yet the highest fish density, of all the dive sites within the GMMRR. This indicates that the fish community at Turtle City consists of a high abundance of small fish , w hich is a potential indicator of a high fishing pressure which has removed large fish from the ecosystem . This theory is supported by the finding that the two families that were virtually absent from the shallows in this study, Snappers and Groupers, are h ighly targeted by fishermen (Figure 11) . The lack of these families may thus be accountable for the relatively low fish biomass in the GMMRR. Conclusion Indonesian coral reefs represent 18% of coral reefs worldwide, provide a primary food source for milli ons of people and contribute an estimated US$1,000,000 km 2 /year to the tourism economy of Indonesia (Cesar, Burke and Pet - Soede, 2003; UNEP, 2006). However, like all coral reef ecosystems, they exist in a delicate balance. Excessive abiotic (pollution, te mperature increase) and biotic threats (overfishing, invasive species) can quickly tip this balance, and lead to declines in reef health. While reefs do

17 have a certain recovery potential or re
have a certain recovery potential or resilience, there is critical threshold beyond which their recover y is unlikely, leading to ecological cascades that can turn a healthy reef into destitute system, with diminished biodiversity and ecosystem products. 16 As reported by the current study, reef health within the GMMRR is generally low, and at certain dive site s reef health is rapidly declining. It is therefore of vital importance that these reefs are effectively managed. Coral restoration projects, which have proved successful on coral reefs around the world, are a simple approach to increasing hard coral cover and subsequent coral reef community health. Further applications and monitoring of coral restoration projects within the GMMRR, such as th e one being created by Gili Shark Conservation , may prove useful in the conservation of these reefs. With respect to directly managing the fish populations, the application of a minimum legal size for commercial species, could also be a valuable strategy in the improvement of the low fish biomass found in the GMMRR . Furthermore, an

18 effective management strategy should co
effective management strategy should co nsider the presence and redundancy of functional groups within the coral reef ecosystem, especially those which are known to promote reef health, and thus the protection of herbivorous reef fish such as Parrotfish could be an effective strategy within the GMMRR (Bellwood, Hughes, Folke and Nyström, 2004) . 17 Bibliography Bakti, L.A.A., Virgota, A., Damayanti, L.P.A., Radiman, T.H.U., Retnowulan, A., Sabil, A. and Robbe, D., 2012. Biorock Reef Restoration in Gili Trawangan, North Lombok, Indonesia (pp. 59 - 80) . Florida, USA: CRC Press. Bellwood, D.R., Hughes, T.P., Folke, C. and Nyström, M., 2004. Confronting the coral reef crisis. Nature , 429 (6994), p.827. Cesar, H.J.S., Burke, L., and Pet - Soede , L. 2003. The Economics of Worldwide Coral Reef Degradation. Cesar Environmental Economics Consulting, Arnhem, and WWF - Netherlands, Zeist, The Netherlands. 23pp. Online at: http://assets.panda.org/downloads/cesardegradationreport100203.pdf Froese, R., J. Thorson and R.B. Reyes Jr., 2013. A Bayesian approach for estimat

19 ing length - weight relationships in fi
ing length - weight relationships in fishes. J. Appl. Ichthyol. (2013):1 - 7. Giyanto, Mumby, Peter., Dhewani, N., Abrar, M., Iswari, M. Y. (2017). Coral Reef Health Index of Indonesia. Research Center for Oceanography and Indonesia Institute of Science. Hourigan T.F., Timothy C.T., Reese E.S. (1988) Coral Reef Fishes as Indicators of Environmental Stress in Coral Reefs. In: Soule D.F., Kleppel G.S. (eds) Marine Organisms as Indicators. Springer, New York, NY IUCN Red List of Threatened Species. (2019). The IUCN Red List of Threatened Species. [online] Available at: https://www.iucnredlist.org/species/178 012/1520757 [Accessed 28 May 2019]. 18 Spalding, Mark, Corinna Ravilious, and Edmund Green (2001). World Atlas of Coral Reefs. Berkeley, CA: University of California Press and UNEP/WCMC ISBN 0520232550 . United Nations Environmental Programme (2006) Corals and mangroves in the front line: economic case for conservation of corals and mangroves made in new UN environment report. http://www.unep.org/Documents.Multilingual/Default.asp? DocumentID=466&ArticleID=5112&l=e