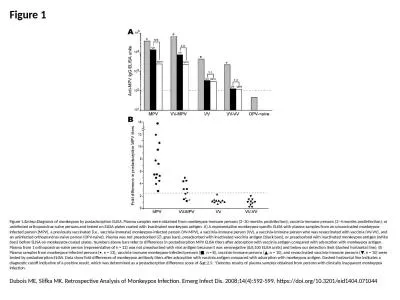
PPT-Figure Figure. Frequency distribution of inhibition ELISA results for Neospora
Author : ruby | Published Date : 2023-09-24
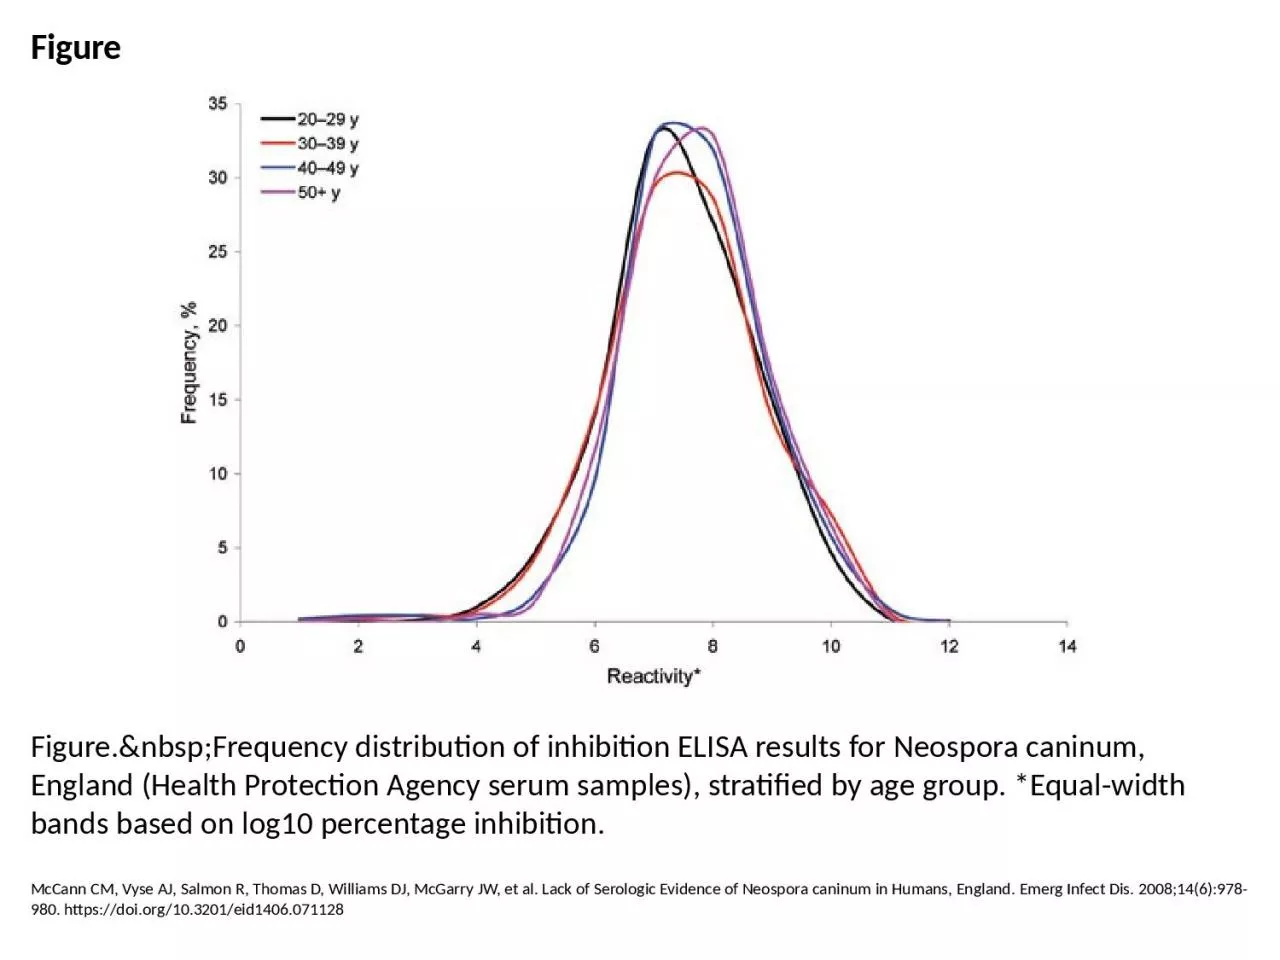
McCann CM Vyse AJ Salmon R Thomas D Williams DJ McGarry JW et al Lack of Serologic Evidence of Neospora caninum in Humans England Emerg Infect Dis 2008146978980
Presentation Embed Code
Download Presentation
Download Presentation The PPT/PDF document "Figure Figure. Frequency distri..." is the property of its rightful owner. Permission is granted to download and print the materials on this website for personal, non-commercial use only, and to display it on your personal computer provided you do not modify the materials and that you retain all copyright notices contained in the materials. By downloading content from our website, you accept the terms of this agreement.
Figure Figure. Frequency distribution of inhibition ELISA results for Neospora: Transcript
Download Rules Of Document
"Figure Figure. Frequency distribution of inhibition ELISA results for Neospora"The content belongs to its owner. You may download and print it for personal use, without modification, and keep all copyright notices. By downloading, you agree to these terms.
Related Documents