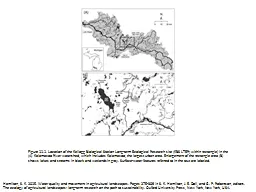
/
Hamilton, S. K. 2015. Water quality and movement in agricultural landscapes. Pages 275-309 Hamilton, S. K. 2015. Water quality and movement in agricultural landscapes. Pages 275-309

Hamilton, S. K. 2015. Water quality and movement in agricultural landscapes. Pages 275-309 - PowerPoint Presentation

sandsomber
sandsomber . @sandsomber
Follow
347 views
Uploaded On 2020-06-22

Hamilton, S. K. 2015. Water quality and movement in agricultural landscapes. Pages 275-309 - PPT Presentation

in S K Hamilton J E Doll and G P Robertson editors The ecology of agricultural landscapes longterm research on the path to sustainability Oxford University Press New York New York ID: 783379

york water landscapes agricultural water york agricultural landscapes hamilton long figure research term press usa university oxford sustainability path

Share:

Link:

Embed:

Download Presentation from below link

Download The PPT/PDF document "Hamilton, S. K. 2015. Water quality and ..." is the property of its rightful owner. Permission is granted to download and print the materials on this web site for personal, non-commercial use only, and to display it on your personal computer provided you do not modify the materials and that you retain all copyright notices contained in the materials. By downloading content from our website, you accept the terms of this agreement.


Presentation Transcript

Slide1

Hamilton, S. K. 2015. Water quality and movement in agricultural landscapes. Pages 275-309

in S. K. Hamilton, J. E. Doll, and G. P. Robertson, editors. The ecology of agricultural landscapes: long-term research on the path to sustainability. Oxford University Press, New York, New York, USA.

Figure 11.1. Location of the Kellogg Biological Station Long-term Ecological Research site (KBS LTER; within rectangle) in the (A) Kalamazoo River watershed, which includes Kalamazoo, the largest urban area. Enlargement of the rectangle area (B) shows lakes and streams in black and wetlands in gray. Surface-water features referred to in the text are labeled.

Slide2

Hamilton, S. K. 2015. Water quality and movement in agricultural landscapes. Pages 275-309

in S. K. Hamilton, J. E. Doll, and G. P. Robertson, editors. The ecology of agricultural landscapes: long-term research on the path to sustainability. Oxford University Press, New York, New York, USA.

Figure 11.2. Distributions of specific conductance of precipitation, soil waters sampled at 1.2 m depth, groundwater pumped from residential wells, and surface waters. The conductance (corrected to 25°C) reflects the total ionic content. Boxes show the interquartile range and median, and lines show the range (arrows indicate outliers not shown here). Data sources: (

i

) Precipitation based on 30 years of year-round monitoring by NADP/NTN (2011) (volume-weighted means for 1979–2008; see Table 11.1); (ii) Soil water from forest based on 98 samples taken at three of the KBS LTER Main Cropping System Experiment (MCSE; Table 11.2) Deciduous Forest plots during Mar–Nov from 2000–2003 (

Kurzman

2006); (iii) Soil water from row-crop fields based on 128 samples taken at three of the MCSE Conventional plots during Mar–Nov from 2000–2003 (

Kurzman

2006); (iv) Groundwater based on 19 pumped well samples collected from 1996–2008; and (v) Streams, wetlands, and lakes based on means for sites (n = 245 streams, 174 wetlands, and 184 lakes), mainly from southwest Michigan except for lakes which were sampled across the Lower Peninsula of Michigan.

Slide3

Hamilton, S. K. 2015. Water quality and movement in agricultural landscapes. Pages 275-309

in S. K. Hamilton, J. E. Doll, and G. P. Robertson, editors. The ecology of agricultural landscapes: long-term research on the path to sustainability. Oxford University Press, New York, New York, USA.

Figure 11.3. Monthly means of precipitation and potential evapotranspiration (

Thornthwaite

method) based on measurements at KBS from 1951–1980. Redrawn from Crum et al. (1990).

Slide4

Hamilton, S. K. 2015. Water quality and movement in agricultural landscapes. Pages 275-309

in S. K. Hamilton, J. E. Doll, and G. P. Robertson, editors. The ecology of agricultural landscapes: long-term research on the path to sustainability. Oxford University Press, New York, New York, USA.

Figure 11.4. Water budget for the Augusta Creek watershed representing a year of average precipitation. Annual fluxes are expressed as equivalent depth of water over the watershed, and as a percentage of the annual precipitation. Shading represents the water table. Data from

Rheaume

(1990)

Slide5

Hamilton, S. K. 2015. Water quality and movement in agricultural landscapes. Pages 275-309

in S. K. Hamilton, J. E. Doll, and G. P. Robertson, editors. The ecology of agricultural landscapes: long-term research on the path to sustainability. Oxford University Press, New York, New York, USA.

Figure 11.5. Ionic composition of precipitation at KBS, expressed as charge equivalents. Data are volume-weighted means for the 30-year monitoring record (1979–2008; see Table 11.1 for sources).

Slide6

Hamilton, S. K. 2015. Water quality and movement in agricultural landscapes. Pages 275-309

in S. K. Hamilton, J. E. Doll, and G. P. Robertson, editors. The ecology of agricultural landscapes: long-term research on the path to sustainability. Oxford University Press, New York, New York, USA.

Figure 11.6. Ionic composition, expressed as charge equivalents, of soil water collected with tension samplers at 1.2 and 1.8 m depths, and of precipitation (data from Fig. 11.5). The soil water samples represent

hydrochemical

changes in precipitation as it percolates through soils without added fertilizer, lime, and organic wastes. Soils at the 1.2-m depth had no detectable carbonate minerals at the three MCSE Deciduous Forest sites, whereas those collected from 1.8-m depth contained abundant carbonate minerals (8

wt

% calcite and 9

wt

% dolomite:

Jin

et al. 2008a). Cond. = specific conductance; ANC = acid neutralizing capacity, due almost entirely to bicarbonate (HCO

3

-

) alkalinity in these waters. Soil water at 1.2 m based on 98 samples taken at three of the KBS Deciduous Forest sites during Mar–Nov from 2000–2003 (data from

Kurzman

2006). Soil water at 1.8 m based on 35 samples from a monolith

lysimeter

located near the MCSE, within the 3BC2 horizon, collected during Mar–May from 2003–2004 (data from

Jin

et al. 2008a).

Slide7

Hamilton, S. K. 2015. Water quality and movement in agricultural landscapes. Pages 275-309

in S. K. Hamilton, J. E. Doll, and G. P. Robertson, editors. The ecology of agricultural landscapes: long-term research on the path to sustainability. Oxford University Press, New York, New York, USA.

Figure 11.7. Total dissolved phosphorus (TDP) and nitrate (NO

3

-

) in soil waters collected with tension samplers at 1.2 m depth from MCSE systems. Row-crop systems receiving fertilizer are shown with solid symbols. Each symbol represents the mean of 100–150 samples collected at a particular site from 2000–2003; n = 3 replicate sites for each system. The regression line is fit to all points and is highly significant (P < 0.001). Data from

Kurzman

(2006).

Slide8

Hamilton, S. K. 2015. Water quality and movement in agricultural landscapes. Pages 275-309

in S. K. Hamilton, J. E. Doll, and G. P. Robertson, editors. The ecology of agricultural landscapes: long-term research on the path to sustainability. Oxford University Press, New York, New York, USA.

Figure 11.8. Determination of nitrate (NO

3

-

) leaching losses from MCSE systems. Modeled water drainage (A) was combined with NO

3

-

concentrations measured at 1.2 m during periods of drainage to estimate mean annual NO

3

-

leaching losses (B) over an 11-year period. Volume-weighted mean NO

3

-

concentrations in drainage water (C) were calculated from the total fluxes and drainage over the 11 years. Means of 100-150 water samples from three replicate plots in each system. The 11-year period from 1995–2006 spanned 3.5 full rotations (corn-soybean-wheat)of the annual cropping systems

. Data

from

Syswerda

et al. (2012).

Slide9

Hamilton, S. K. 2015. Water quality and movement in agricultural landscapes. Pages 275-309

in S. K. Hamilton, J. E. Doll, and G. P. Robertson, editors. The ecology of agricultural landscapes: long-term research on the path to sustainability. Oxford University Press, New York, New York, USA.

Figure 11.9. Ionic composition, expressed as charge equivalents, of groundwater from KBS wells, a groundwater-fed stream (Prairieville Creek) draining outwash plains northwest of KBS, and the large inland lake (Gull Lake) into which that stream flows. Note the increased scale from Figure 11.6. Cond. = specific conductance; NO

3

-

concentrations in groundwater and the lake water were too low to depict. Data are means for 19 groundwater wells with variable sampling dates, 41 sampling dates for the creek, and 86 sampling dates for the lake.

Slide10

Hamilton, S. K. 2015. Water quality and movement in agricultural landscapes. Pages 275-309

in S. K. Hamilton, J. E. Doll, and G. P. Robertson, editors. The ecology of agricultural landscapes: long-term research on the path to sustainability. Oxford University Press, New York, New York, USA.

Figure 11.10. Nitrate export in stream water from Augusta Creek: (A) concentrations, (B) NO

3

-

concentration-discharge relation, and (C) annual NO

3

-

fluxes in the lower reaches of Augusta Creek, which drains land east of and including part of the KBS LTER main site. Annual fluxes are based on the concentration-discharge relation (64 sampling dates) and daily discharge measured by the U.S. Geological Survey.

Slide11

Hamilton, S. K. 2015. Water quality and movement in agricultural landscapes. Pages 275-309

in S. K. Hamilton, J. E. Doll, and G. P. Robertson, editors. The ecology of agricultural landscapes: long-term research on the path to sustainability. Oxford University Press, New York, New York, USA.

Figure 11.11. Calcium (Ca

2+

) and magnesium (Mg

2+

) concentrations in southern Michigan lakes during the summer, and in groundwater from wells at KBS. Assuming similar groundwater composition across the Lower Peninsula, precipitation water inputs would dilute the ion concentrations along the dashed line, whereas calcite precipitation would lower the ratio of Ca

2+

to Mg

2+

. Data based on 152 lakes across southern Michigan, most sampled once in the summer from 1996–2008, and 16 groundwater wells with variable sampling dates.

Slide12

Hamilton, S. K. 2015. Water quality and movement in agricultural landscapes. Pages 275-309

in S. K. Hamilton, J. E. Doll, and G. P. Robertson, editors. The ecology of agricultural landscapes: long-term research on the path to sustainability. Oxford University Press, New York, New York, USA.

Figure 11.12. Concentrations of total dissolved phosphorus (P) and nitrate (NO

3

-

) in lakes (A, B) and wetlands (C, D), in relation to the importance of groundwater as indicated by magnesium (Mg

2+

) concentrations. Groundwater at equilibrium with dolomite tends to contain ~2

meq

L

-1

of Mg

2+

whereas the concentration of Mg

2+

in precipitation is negligible (Fig. 11.11). Data based on 152 lakes across southern Michigan, most sampled once in the summer, and 17 wetland sites in the KBS area, many sampled multiple years in May and Oct; sampling was conducted from 1996–2008.