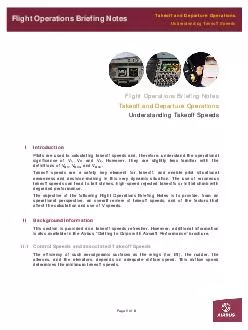
/
Operations Strategies A look at the syllabus Operations Strategies A look at the syllabus

Operations Strategies A look at the syllabus - PowerPoint Presentation

sandsomber
sandsomber . @sandsomber
Follow
344 views
Uploaded On 2020-06-25

Operations Strategies A look at the syllabus - PPT Presentation

Performance objectives What do we consider to be the key areas of interest when considering our operations success Performance objectives Objective Description Quality Quality is a measure of excellence or a state of ID: 786660

price cost method sold cost price sold method stock 500 profitability total units inventory 450 400 boxes fifo delivery

Share:

Link:

Embed:

Download Presentation from below link

Download The PPT/PDF document "Operations Strategies A look at the syll..." is the property of its rightful owner. Permission is granted to download and print the materials on this web site for personal, non-commercial use only, and to display it on your personal computer provided you do not modify the materials and that you retain all copyright notices contained in the materials. By downloading content from our website, you accept the terms of this agreement.


Presentation Transcript

Slide1

Operations Strategies

Slide2

A look at the syllabus

Slide3

Performance objectives

What do

we consider to be the

key areas

of

interest when considering our operations success?

Slide4

Performance objectives

Objective

Description

Quality

Quality is a measure of excellence or a state of

being free from defects, deficiencies, and significant variations

Speed

How quickly does production take and how quickly can it respond

to changes in demand?

Dependability

How

uniform, consistent and reliable a businesses products are.

Flexibility

How quickly

operations processes can adjust to changes in the market?

Customisation

Refers

to creation of individualised products to meet the specific needs of customers

Cost

Minimisation

of expenses so that the operations function can be completed as cheaply as possible.

Slide5

Performance objectives

Q

antas

S

ales

D

epend

F

oreign

C

ustomers

C

alling

Slide6

Come up with some KPIs for each

Objective

Examples

of KPIs

Quality

Number of defects in production

Amount of warranty returns processed.

Awards won.

Speed

Output per hour/day/week

lead times (time between order and delivery)

Dependability

- How uniform/identical the products are

Flexibility

- Variation in the output on a daily basis

(can you tolerate volatile orders?)

Customisation

- Number of unique orders

processed.

Cost

Total production costs

Costs per unit of output

Staff overtime wages level

Total staff efficiency

Slide7

Strategy 1: Outsourcing

Outsourcing is the use of external providers to perform non-core business activities on your behalf in exchange for a fee.

Usually this is done because they can do the tasks required at a lower cost than you can.

Slide8

What types of things can be outsourced?

Accounting

IT

manufacturing

Legal advice

Pretty much anything nowadays

Slide9

Outsourcing video

http://www.youtube.com/watch?v=rYaZ57Bn4pQ

Slide10

Outsourcing – pros and cons (p.91)

Advantages

Disadvantages

Potential cost savings

Superior quality available from the outsourcer because this work represents their core competency.

Reduced employment on-costs

(superannuation, workers compensation insurance).

increased accountability over the area that has been outsourced.

Access to skills/qualifications that are outside the realm of the current staff.

By outsourcing

non-core elements of the business, it can better focus on its core duties and drive improvements.

Service Level Agreements (SLAs) can provide compensation to your firm if the quality of work is poor.

Loss of control

over the outsourced process.

loss of ability in the outsourced area within the company. (i.e. Once you outsource your IT systems, you will never be able to reintegrate them back into the company without great expense and time).

Loss of corporate memory

Organisational resistance to change from employees

Payback period and costs: The first few years of outsourcing may be more expensive as you have to also consider the redundancy payments due to original workers no longer needed

.

Privacy breaches may occur because customer information is stored in another providers property.

Slide11

Operations Strategies 2: Inventory Management

Inventory Management refers to the amount of stock that a business has on hand at any particular point in time. (raw materials, work-in progress and finished goods).

Slide12

Advantages of holding stock?

Consumer demand can be met immediately. Less chance they will leave the premises and buy from somewhere else.

Reduces lead times between order and delivery of product

Making purchases in bulk can reduce the cost price per item. These big purchases need to be warehouses somewhere, hence stock is accumulated.

Slide13

Disadvantages of holding stock?

Numerous costs including : leasing the facility, insurance, theft and handling expenses, security costs, obsolescence (if can’t be sold),

Stock represents cash tied up and not earning any interest.

Slide14

HOW THE HELL DO I CALCULATE MY PROFITABILTIY FOR THE SALES I MAKE?!!??!!

Valuing Stock

A petrol station takes TWO fuel deliveries per week.

Delivery 1] The cost they paid was $1.45 per litre for 500,000 litres.

Delivery 2] The cost they paid was $1.10 per litre for 200,000 litres

Slide15

Valuing Stock

http://www.youtube.com/watch?v=ExNsFh0_39s

(LIFO

vs

FIFO)

Slide16

Inventory valuation methods

Step 1)

JB HIFI bought 3 X-boxes at the cost of $500 each in the first delivery.

THEN

Step 2)

JB HIFI bought another 5 X-boxes at the cost of $400 each in the second delivery.

STEP 3)

A customer comes up and buys an X-box for $450 from you. How much profit does JB-HIFI make?

Slide17

LAST IN FIRST OUT (LIFO) Method

One method that can be used is called the LIFO method.

This method of valuing inventory assumes that

the last batch order of goods are also the first goods sold

and therefore values the cost of this number of units sold at the cost of the last batch purchased.

E.g. The last delivery of 5 X-boxes are assumed to be sold first, and as a result the first 5 X-boxes sold will all be costed at $400 each.

The remaining 3 X-boxes will be costed at the previous cost price $500

Cost Price $ 500 each

Cost price = $400 each

Slide18

FIRST IN FIRST OUT (FIFO) METHOD

Another method that can be used is called the FIFO method.

This method of valuing inventory assumes that

first batch of goods purchased are the first goods sold

and therefore values the cost of this number of units sold at the cost of the first batch purchased.

E.g. The first delivery of 3 X-boxes are assumed to be sold first, and as a result the first 3 X-boxes sold will all be costed at $500 each.

The remaining 5 X-boxes will be costed at the previous cost price $400 each.

Cost Price $ 500 each

Cost price = $400 each

Slide19

FIRST IN FIRST OUT (FIFO) METHOD

Cost Price $ 500 each

LIFO PROFITABILITY

FIFO PROFITABILITY

5

units sold at cost price of $400 each and sale price of $450 each.

There is a total profit of $250

3 units sold at cost price of $500 each and sale price of $450 each.

There is a total loss of $150

The last 3 units then sell at a cost of $500 each and sold at the sale price of $450 each.

Therefore there is a total loss of $150.

The last 5 units then sell at a cost of $400 each and sold at the sale price of $450 each.

Therefore there is a total profit of $250.

Overall profitability = $100

Overall

Profitability = $100

Slide20

Some general conclusions

The overall profitability will be identical over a long enough time period.

However, the different methods will produce different results in the short-term.

LIFO PROFITABILITY

FIFO PROFITABILITY

5

units sold at cost price of $400 each and sale price of $450 each.

There is a total profit of $250

3 units sold at cost price of $500 each and sale price of $450 each.

There is a total loss of $150

The last 3 units then sell at a cost of $500 each and sold at the sale price of $450 each.

Therefore there is a total loss of $150.

The last 5 units then sell at a cost of $400 each and sold at the sale price of $450 each.

Therefore there is a total profit of $250.

Overall profitability = $100

Overall

Profitability = $100

Early on there is

Big difference in profitability

Eventually it sorts itself out.

Slide21

Some general conclusions

LIFO

FIFO

Because the cost

of goods tend to rise throughout the year, the LIFO method tends to overstate the cost and understand the profit in the current period.

- Because the cost

of goods tend to rise throughout the year, the FIFO method tends to understate the cost and overstate the profit in the current period.

Most businesses use this because it makes sense to try and sell your oldest inventory first you are able to identify them as older stock (especially if inventory can perish).

They also prefer this method because it usually produces a higher profitability result in the near term if we assume that the goods become more expensive over time.***

***Note:

the opposite effect has happened in our example because the X-box falls in price over time. It is an unusual circumstance.

Slide22

Just in Time – Inventory method

An inventory management system that ensures that the exact amount of material inputs will arrive only as they are needed in the operations process.

Benefits include

Easier to conduct stock take (less stock on hand)

Retailers can display a wider range of products because they do not have to stock as many duplicates

Saves on all stock related expenses mentioned earlier