PDF-A Graphical Method for Estimation of Barometric Efficiency from Contin
Author : sherrill-nordquist | Published Date : 2016-09-19
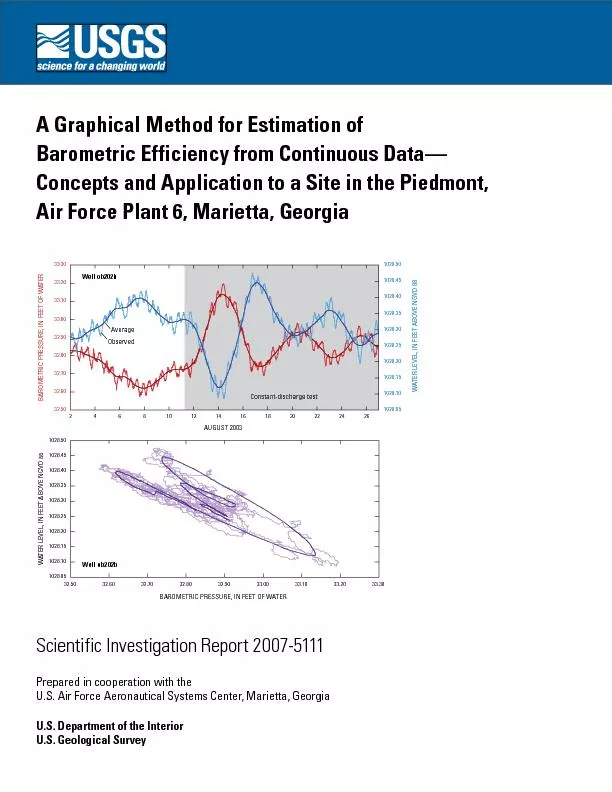
325032603270328032903300331033203330 2468101214161820222426Well ob202bWell ob202bBAROMETRIC PRESSURE IN FEET OF WATERBAROMETRIC PRESSURE IN FEET OF WATERWATER LEVEL
Presentation Embed Code
Download Presentation
Download Presentation The PPT/PDF document "A Graphical Method for Estimation of Bar..." is the property of its rightful owner. Permission is granted to download and print the materials on this website for personal, non-commercial use only, and to display it on your personal computer provided you do not modify the materials and that you retain all copyright notices contained in the materials. By downloading content from our website, you accept the terms of this agreement.
A Graphical Method for Estimation of Barometric Efficiency from Contin: Transcript
Download Rules Of Document
"A Graphical Method for Estimation of Barometric Efficiency from Contin"The content belongs to its owner. You may download and print it for personal use, without modification, and keep all copyright notices. By downloading, you agree to these terms.
Related Documents