PPT-Financial Performance of Safety-Net Hospitals Compared with Other
Author : sherrill-nordquist | Published Date : 2018-03-10
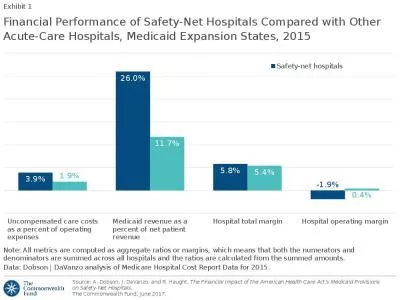
AcuteCare Hospitals Medicaid Expansion States 2015 Exhibit 1 Note All metrics are computed as aggregate ratios or margins which means that both the numerators and
Presentation Embed Code
Download Presentation
Download Presentation The PPT/PDF document "Financial Performance of Safety-Net Hosp..." is the property of its rightful owner. Permission is granted to download and print the materials on this website for personal, non-commercial use only, and to display it on your personal computer provided you do not modify the materials and that you retain all copyright notices contained in the materials. By downloading content from our website, you accept the terms of this agreement.
Financial Performance of Safety-Net Hospitals Compared with Other: Transcript
Download Rules Of Document
"Financial Performance of Safety-Net Hospitals Compared with Other"The content belongs to its owner. You may download and print it for personal use, without modification, and keep all copyright notices. By downloading, you agree to these terms.
Related Documents