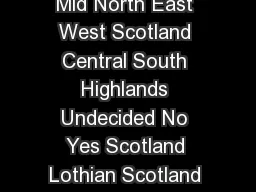
/
Referendum Vote ScotRegion  Holyrood Vote Age Gender Total Mid North East West Scotland Referendum Vote ScotRegion  Holyrood Vote Age Gender Total Mid North East West Scotland

Referendum Vote ScotRegion Holyrood Vote Age Gender Total Mid North East West Scotland - PDF document

sherrill-nordquist
sherrill-nordquist . @sherrill-nordquist
Follow
569 views
Uploaded On 2014-12-04

Referendum Vote ScotRegion Holyrood Vote Age Gender Total Mid North East West Scotland - PPT Presentation

0 1000 1000 1000 1000 1000 1000 1000 1000 1000 1000 1000 1000 1000 1000 1000 1000 1000 1000 1000 1000 1000 1000 1000 120 459 405 144 136 130 129 128 122 122 89 311 54 217 95 203 153 180 167 153 144 516 485 1001 SIGMA 1000 1000 1000 1000 1000 1000 100 ID: 20978

1000 1000 1000 1000

Share:

Link:

Embed:

Download Presentation from below link

Download Pdf The PPT/PDF document "Referendum Vote ScotRegion Holyrood Vot..." is the property of its rightful owner. Permission is granted to download and print the materials on this web site for personal, non-commercial use only, and to display it on your personal computer provided you do not modify the materials and that you retain all copyright notices contained in the materials. By downloading content from our website, you accept the terms of this agreement.


Presentation Transcript

Scottish 2 nd Debate R eactions Poll Methodology Referendum Vote ScotRegion 2011 Holyrood Vote Age Gender Total Mid North East West Scotland Central South Highlands Undecided No Yes Scotland Lothian Scotland Glasgow and Fife Scotland Scotland and Islands SNP LD Lab Con 65+ 55-64 45-54 35-44 25-34 16-24 Female Male 135451 3991241532011709711364 7929754194 105147219200183183 69553 448 1001Unweighted Total 120459 405144136130129128122122 8931154217 95203153180167153 144516 485 1001Weighted Total 120459 405144136130129128122122 8931154217 95203153180167153 144516 485 1001Scotland 100.0%100.0% 100.0%100.0%100.0%100.0%100.0%100.0%100.0%100.0% 100.0%100.0%100.0%100.0% 100.0%100.0%100.0%100.0%100.0%100.0% 100.0%100.0% 100.0% 100.0% 120459 405144136130129128122122 8931154217 95203153180167153 144516 485 1001SIGMA 100.0% 100.0% 100.0% 100.0% 100.0% 100.0% 100.0% 100.0% 100.0% 100.0% 100.0% 100.0% 100.0% 100.0% 100.0% 100.0% 100.0% 100.0% 100.0% 100.0% 100.0% 100.0% 100.0% 100.0%Page 4Scottish 2nd Debate Reactions Poll Prepared by Survation on behalf of the Daily Mail28 Aug 2014Table 1Q1. Where do you currently live?Base : All Respondents Prepared by Survation on behalf of the Daily Mail Page 4 Referendum Vote ScotRegion 2011 Holyrood Vote Age Gender Total Mid North East West Scotland Central South Highlands Undecided No Yes Scotland Lothian Scotland Glasgow and Fife Scotland Scotland and Islands SNP LD Lab Con 65+ 55-64 45-54 35-44 25-34 16-24 Female Male 135451 3991241532011709711364 7929754194 105147219200183183 69553 448 1001Unweighted Total 120459 405144136130129128122122 8931154217 95203153180167153 144516 485 1001Weighted Total 2054 52129 3728 141717192625 2572 57 129Glasgow 16.8%11.7% 12.8%100.0% 11.9%6.4%12.8% 14.7%8.3%10.9%10.7%15.7%16.5% 17.1%13.9% 11.8% 12.9% 2155 54130 4635 112817272516 1866 64 130West Scotland 17.4%12.0% 13.3%100.0% 14.7%8.5%16.2% 11.7%13.6%11.3%14.8%14.8%10.4% 12.5%12.9% 13.1% 13.0% 77 47136 4030 192424261925 1868 68 136Lothian 7.8%16.8% 11.6%100.0% 13.0%8.8%13.8% 20.1%11.6%16.0%14.4%11.2%16.5% 12.6%13.1% 14.1% 13.6% 2148 53122 4030 1914192228 2070 52 122Central Scotland 17.3%10.5% 13.2%100.0% 12.7%1.6%13.8% 3.6%9.5%9.2%10.7%13.0%18.2% 13.8%13.7% 10.6% 12.2% 1259 45122 291029 193419222010 1752 70 122South Scotland 10.3%12.9% 11.0%100.0% 9.3%17.6%13.5% 19.6%16.8%12.6%12.0%12.2%6.7% 11.5%10.0% 14.5% 12.2% 1256 56128 421531 2926142417 1763 66 128Mid Scotland and 9.6%12.2% 13.8%100.0% 13.6%27.2%14.1% 5.8%14.4%17.3%7.5%14.5%11.2% 12.1%12.1% 13.5% 12.8%Fife 1568 61144 5423 142727381921 1282 63 144North East Scotland 12.3%14.8% 15.2%100.0% 17.5%15.2%10.6% 14.6%13.2%17.5%21.2%11.4%13.4% 8.7%15.8% 12.9% 14.4% 1042 37 892311 26161211 1743 46 89Highlands and 8.4%9.1% 9.2% 100.0%7.3%14.7%5.2% 9.9%12.6%5.2%8.7%7.2%7.2% 11.6%8.4% 9.4% 8.9%Islands 120459 405144136130129128122122 8931154217 95203153180167153 144516 485 1001SIGMA 100.0% 100.0% 100.0% 100.0% 100.0% 100.0% 100.0% 100.0% 100.0% 100.0% 100.0% 100.0% 100.0% 100.0% 100.0% 100.0% 100.0% 100.0% 100.0% 100.0% 100.0% 100.0% 100.0% 100.0%Page 5Scottish 2nd Debate Reactions Poll Prepared by Survation on behalf of the Daily Mail28 Aug 2014Table 2Q2. Which electoral region of Scotland do you live in?Base : All Respondents Prepared by Survation on behalf of the Daily Mail Page 5 Referendum Vote ScotRegion 2011 Holyrood Vote Age Gender Total Mid North East West Scotland Central South Highlands Undecided No Yes Scotland Lothian Scotland Glasgow and Fife Scotland Scotland and Islands SNP LD Lab Con 65+ 55-64 45-54 35-44 25-34 16-24 Female Male 135451 3991241532011709711364 7929754194 105147219200183183 69553 448 1001Unweighted Total 120459 405144136130129128122122 8931154217 95203153180167153 144516 485 1001Weighted Total 1763 5912181825172017 172010 ------ 144105 39 14416-24 13.8%13.7% 14.5%8.7%13.4%13.8%19.1%13.6%16.3%13.6% 18.8%6.4%4.3%4.8% ------ 100.0%20.3% 8.1% 14.4% 2159 6921251625172810 114229 153 102 51 15325-34 17.3%12.8% 17.1%14.3%18.5%12.2%19.6%13.4%22.8%8.4% 12.4%13.6%8.0%13.1% 9.5%100.0% 19.7% 10.6% 15.3% 2468 7219192526242220 124748 16167 89 78 16735-44 20.2%14.9% 17.9%13.2%13.8%19.0%20.4%18.9%17.7%16.7% 13.6%15.2%14.7%22.0% 17.1%100.0% 17.3% 16.1% 16.7% 2769 8238262719141922 167042 13180 84 96 18045-54 22.1%15.0% 20.2%26.6%19.1%20.5%14.9%10.6%15.7%17.6% 17.5%22.6%16.4%19.3% 14.1%100.0% 16.3% 19.8% 18.0% 1777 5927241717261419 5543 19153 69 84 15355-64 13.9%16.8% 14.6%18.6%18.0%13.3%13.0%20.7%11.5%15.8% 8.9%17.8%16.2%19.9% 19.9%100.0% 13.4% 17.3% 15.3% 15123 6427242817291934 26762246 38203 67 137 20365+ 12.7%26.8% 15.8%18.7%17.3%21.2%13.0%22.9%15.9%27.9% 28.8%24.4%40.4%20.9% 39.5%100.0% 12.9% 28.1% 20.3% 120459 405144136130129128122122 8931154217 95203153180167153 144516 485 1001SIGMA 100.0% 100.0% 100.0% 100.0% 100.0% 100.0% 100.0% 100.0% 100.0% 100.0% 100.0% 100.0% 100.0% 100.0% 100.0% 100.0% 100.0% 100.0% 100.0% 100.0% 100.0% 100.0% 100.0% 100.0%Page 6Scottish 2nd Debate Reactions Poll Prepared by Survation on behalf of the Daily Mail28 Aug 2014Table 3Q3. Which of the following age brackets do you fall into?Base : All Respondents Prepared by Survation on behalf of the Daily Mail Page 6 Referendum Vote ScotRegion 2011 Holyrood Vote Age Gender Total Mid North East West Scotland Central South Highlands Undecided No Yes Scotland Lothian Scotland Glasgow and Fife Scotland Scotland and Islands SNP LD Lab Con 65+ 55-64 45-54 35-44 25-34 16-24 Female Male 135451 3991241532011709711364 7929754194 105147219200183183 69553 448 1001Unweighted Total 120459 405144136130129128122122 8931154217 95203153180167153 144516 485 1001Weighted Total 42221 21463686457665270 4619129110 5513784967851 39 485 485Male 34.8%48.1% 52.9%43.4%50.3%48.9%44.4%51.1%42.3%57.7% 51.3%61.3%52.6%50.5% 57.4%67.2%54.9%53.2%46.7%33.5% 27.3% 100.0% 48.5% 78238 19182686672637052 4312126108 4167698489102 105516 - 516Female 65.2%51.9% 47.1%56.6%49.7%51.1%55.6%48.9%57.7%42.3% 48.7%38.7%47.4%49.5% 42.6%32.8%45.1%46.8%53.3%66.5% 72.7%100.0% - 51.5% 120459 405144136130129128122122 8931154217 95203153180167153 144516 485 1001SIGMA 100.0% 100.0% 100.0% 100.0% 100.0% 100.0% 100.0% 100.0% 100.0% 100.0% 100.0% 100.0% 100.0% 100.0% 100.0% 100.0% 100.0% 100.0% 100.0% 100.0% 100.0% 100.0% 100.0% 100.0%Page 7Scottish 2nd Debate Reactions Poll Prepared by Survation on behalf of the Daily Mail28 Aug 2014Table 4Q4. What is your gender?Base : All Respondents Prepared by Survation on behalf of the Daily Mail Page 7 Referendum Vote ScotRegion 2011 Holyrood Vote Age Gender Total Mid North East West Scotland Central South Highlands Undecided No Yes Scotland Lothian Scotland Glasgow and Fife Scotland Scotland and Islands SNP LD Lab Con 65+ 55-64 45-54 35-44 25-34 16-24 Female Male 135451 3991241532011709711364 7929754194 105147219200183183 69553 448 1001Unweighted Total 120459 405144136130129128122122 8931154217 95203153180167153 144516 485 1001Weighted Total 1337 491319201220 3413 1015221518 2050 52 102Less than £10,000 11.0%8.0% 12.0%3.8%9.3%14.6%15.9%9.3%16.0%5.3% 6.5%11.0%5.3%5.9% 2.1%4.9%10.1%12.2%9.1%12.1% 14.2%9.7% 10.6% 10.1% 1348 48141116141817 122835 2918151016 2269 42 111£10,000 - £14,999 10.8%10.4% 11.8%9.5%8.1%12.2%10.9%14.4%13.5%7.5% 13.6%9.1%11.5%16.1% 5.0%14.4%11.8%8.5%6.2%10.4% 15.2%13.4% 8.6% 11.1% 1347 491720161717 145019 102220182718 1249 67 117£15,000 - £19,999 10.8%10.3% 12.0%11.8%14.4%6.9%12.1%13.0%7.0%13.5% 15.4%16.2%3.9%8.8% 11.0%10.8%12.9%9.9%16.2%11.6% 8.5%9.6% 13.9% 11.7% 2489 8331201821282729 23631039 235634342629 17108 88 196£20,000 - £29,999 19.7%19.3% 20.6%21.2%15.0%13.9%16.1%21.5%21.9%23.8% 26.1%20.2%19.0%17.9% 23.7%27.7%22.2%18.7%15.8%18.8% 11.9%21.0% 18.2% 19.6% 1580 63311925171824 16451436 223615382726 1665 93 158£30,000 - £39,999 12.4%17.5% 15.5%21.3%13.6%19.0%12.9%7.1%14.5%19.9% 18.3%14.3%26.6%16.4% 23.3%17.5%10.0%20.9%16.3%17.2% 11.1%12.6% 19.2% 15.8% 1247 381617111616 3221 131715181815 1453 44 97£40,000 - £49,999 9.8%10.2% 9.3%11.3%12.3%8.4%12.6%12.2%6.1%7.8% 4.9%10.2%10.0%9.4% 14.1%8.4%9.6%9.9%10.9%9.8% 9.9%10.2% 9.1% 9.7% 31 1813 13 15 1431 24 54£50,000 - £59,999 3.9%6.8% 4.5%5.5%5.9%4.1%5.8%10.2%5.5%1.3% 4.8%3.0%16.1%6.2% 2.5%4.5%1.7%4.9%9.0%3.1% 9.8%5.9% 4.9% 5.4% 16 19 1513 10 20 20 40£60,000 - £69,999 3.0%3.4% 4.6%3.1%6.9%4.5%5.1%1.2%5.1%1.4% 4.5%4.8%3.4%5.8% 3.7%2.6%3.1%3.9%6.0%6.1% 2.5%3.9% 4.1% 4.0% -8 62322121 16-2 2-5132 10 5 14£70,000 - £79,999 1.7% 1.6%1.3%2.2%1.6%1.4%1.1%1.3%1.2% 1.0%1.9%0.9% 2.0%3.4%0.3%1.8%1.4% 2.3%1.9% 1.0% 1.4% *6 3-33*11- -111 2-21-2 36 3 £80,000 - £89,999 0.1%1.2% 0.7%2.3%2.4%0.1%0.7%1.1% 0.2%1.1%0.3% 1.9%1.3%0.8%1.5% 2.0%1.2% 0.5% 0.9% 13 212111-- -1-2 --12*2 -4 2 £90,000 - £99,000 0.8%0.6% 0.5%0.7%1.6%0.6%0.5%0.7% 0.3%0.8% 0.9%0.9%0.1%1.5% 0.7% 0.4% 0.6% 14 112-1--1 -1-2 3-2-31 -1 4 £100,000 - £149,999 0.7%0.9% 0.2%0.8%1.3%1.1%1.0% 0.2%0.9% 3.2%1.3%1.7%0.5% 0.3% 0.9% 0.6% 1- 1--11--- -1-- ----11 -1 1 £150,000 - £199,999 0.7% 0.1%0.4%0.7% 0.3% 0.3%0.5% 0.1% 0.2% 0.1% 2044 261415111021 2623 19181611 1849 41 90Don't know / prefer 16.4%9.6% 6.4%9.5%6.9%11.4%4.9%8.6%7.9%17.3% 4.9%8.2%3.2%10.5% 7.4%9.2%11.7%9.1%6.6%5.4% 12.6%9.5% 8.5% 9.0%not to say 120459 405144136130129128122122 8931154217 95203153180167153 144516 485 1001SIGMA 100.0% 100.0% 100.0% 100.0% 100.0% 100.0% 100.0% 100.0% 100.0% 100.0% 100.0% 100.0% 100.0% 100.0% 100.0% 100.0% 100.0% 100.0% 100.0% 100.0% 100.0% 100.0% 100.0% 100.0%Page 8Scottish 2nd Debate Reactions Poll Prepared by Survation on behalf of the Daily Mail28 Aug 2014Table 5Q5. What best describes your household income, including all benefits, but before tax is deducted?Base : All Respondents Prepared by Survation on behalf of the Daily Mail Page 8 Referendum Vote ScotRegion 2011 Holyrood Vote Age Gender Total Mid North East West Scotland Central South Highlands Undecided No Yes Scotland Lothian Scotland Glasgow and Fife Scotland Scotland and Islands SNP LD Lab Con 65+ 55-64 45-54 35-44 25-34 16-24 Female Male 95302 26581105133111588244 5720934130 71111146129122111 52368 303 671Unweighted Total 85316 27799958986788988 6622435149 6815910111211395 109347 343 690Weighted Total 24 14 1318 2311 19 24 42No Qualifications 5.3%7.6% 5.0%7.5%3.0%7.9%2.7%3.2%7.5%9.7% 7.8%5.8%12.1% 3.0%14.4%11.0%5.4%1.1%1.2% 5.4% 6.9% 6.1% 13 13 1113 16 37 22 29A formal 2.5%4.0% 4.7%3.1%3.2%5.6%1.7%7.2%8.2% 5.2%4.9%9.2%8.5% 10.1%4.3%3.1%1.9% 2.7%2.0% 6.4% 4.2%apprenticeship 26 3610101011 2918 15101413 1334 37 71NVQs/GNVQs/RSA 9.8%8.3% 13.1%8.5%9.6%11.5%11.2%5.2%11.3%13.1% 12.8%12.9%14.5%12.0% 3.9%9.3%10.3%12.4%11.5%6.7% 11.8%9.9% 10.8% 10.4%Diploma 36101 7531293021183729 205939 151728394331 55116 98 214GCSEs/O-Levels/ 42.8%31.9% 27.2%30.9%30.2%33.3%24.2%22.6%42.2%33.0% 30.6%26.4%25.9%26.5% 21.6%10.9%28.1%34.5%37.9%33.3% 50.4%33.4% 28.6% 31.0%Standard Grades 11 14 11 10 21 12 33Diploma (General) 5.5%3.6% 5.1%3.5%6.2%5.9%4.4%11.4%1.5% 6.4%5.0%13.1%3.0% 2.2%2.2%3.7%5.5%8.5%2.4% 7.0%6.0% 3.6% 4.8% 1376 42222414201412 163623 121815201624 3976 57 132AS-Levels / Scottish 14.8%24.1% 15.0%22.8%25.3%16.2%23.0%18.0%13.6%10.1% 24.9%16.3%22.1%15.6% 18.1%11.6%15.2%17.7%14.0%25.4% 35.5%21.9% 16.5% 19.2%Highers 47 121510 5927 1010 2837 29 65A-Levels / Advanced 5.9%14.9% 4.2%7.8%15.3%8.4%11.8%10.2%6.4%7.7% 7.4%4.0%4.9%5.0% 12.2%3.2%7.0%9.2%3.8%10.7% 25.9%10.6% 8.3% 9.5%Highers 52 39121813151114 4216 203615221110 50 49 100Professional 10.5%16.6% 13.9%12.0%18.8%14.4%17.4%14.3%8.3%16.2% 14.3%18.6%21.7%10.6% 30.0%22.9%14.9%19.9%9.7%10.2% 5.0%14.5% 14.4% 14.5%Qualifications (i e Teaching, Nursing, Accountancy) 2592 7531362321282321 16611346 243929244530 3198 101 199Degree/Postgraduate 29.5%29.1% 27.0%30.9%37.6%26.3%24.6%35.4%26.1%23.4% 24.7%27.5%37.6%30.9% 35.3%24.3%28.6%21.5%39.9%32.1% 28.6%28.2% 29.3% 28.8%Degree (i e BA, BSc, MA, MSc, MRes, MBA, PGCE) 1320 26111010 17 121311 24 35 59Other (incl 14.8%6.4% 9.4%7.1%11.1%7.2%5.5%12.8%10.0%11.1% 1.8%7.6%10.5%5.5% 8.7%7.6%13.1%6.2%7.8%11.4% 6.2%6.9% 10.1% 8.5%Vocational training i e forklift licence, construction skills certification scheme (CSCS), food hygiene certificate & Foreign Qualifications) 120462 346129153120113105118118 8928956193 92185138152154126 189481 463 945SIGMA 141.3% 146.4% 124.6% 131.1% 160.2% 134.3% 130.4% 134.9% 132.7% 134.0% 135.9% 128.9% 159.4% 129.9% 135.1% 116.4% 136.0% 135.2% 136.0% 133.5% 173.1% 138.9% 134.9% 136.9%Page 9Scottish 2nd Debate Reactions Poll Prepared by Survation on behalf of the Daily Mail28 Aug 2014Table 6Q6. Which of these qualifications do you have?Base : All Answering Prepared by Survation on behalf of the Daily Mail Page 9 Referendum Vote ScotRegion 2011 Holyrood Vote Age Gender Total Mid North East West Scotland Central South Highlands Undecided No Yes Scotland Lothian Scotland Glasgow and Fife Scotland Scotland and Islands SNP LD Lab Con 65+ 55-64 45-54 35-44 25-34 16-24 Female Male 32 26171112 1616 1415111310 39 27 66Unweighted Total 29 2713 1819 191111 32 31 63Weighted Total -1 91-23-23 -512 -3-132 23 7 10NVQ Level 1 or a 3.3% 35.0%13.6%25.2%27.8%12.5%44.3% 26.1%22.2%10.4% 16.2%5.9%32.8%24.5% 33.1%9.5% 23.8% 16.5%Foundation GNVQ 15 63551371 -528 -47435 15 10 25NVQ Level 2 or an 58.1%52.6% 21.4%35.9%61.5%56.0%12.0%49.6%50.2%20.3% 25.8%77.8%44.9% 18.6%68.6%40.8%32.6%59.2% 38.7%46.1% 32.9% 39.6%Intermediate GNVQ or an RSA Diploma 28 833*1152 26-7 *92431 -8 10 18NVQ Level 3 or an 32.6%27.9% 28.3%37.2%38.5%5.3%13.2%20.8%37.3%35.4% 64.8%33.7%38.8% 14.2%46.6%22.5%33.4%28.6%7.3% 24.1% 33.8% 28.9%Advanced GNVQ or an RSA Advanced Diploma 15 41-142-- 13-1 341211 16 3 NVQ Level(s)4-5 or 9.3%16.2% 15.3%13.3%13.5%47.1%29.6% 35.2%14.4%5.9% 85.8%18.7%8.9%19.9%6.0%9.0% 28.2%20.2% 9.5% 14.9%an RSA Higher Diploma 29 2713 1819 191111 32 31 63SIGMA 100.0% 100.0% 100.0% 100.0% 100.0% 100.0% 100.0% 100.0% 100.0% 100.0% 100.0% 100.0% 100.0% 100.0% 100.0% 100.0% 100.0% 100.0% 100.0% 100.0% 100.0% 100.0% 100.0% 100.0%Page 10Scottish 2nd Debate Reactions Poll Prepared by Survation on behalf of the Daily Mail28 Aug 2014Table 7Q6.1. You selected NVQs/GNVQs/RSA Diploma. At which level is your highest qualification?Base : All Answering Prepared by Survation on behalf of the Daily Mail Page 10 Referendum Vote ScotRegion 2011 Holyrood Vote Age Gender Total Mid North East West Scotland Central South Highlands Undecided No Yes Scotland Lothian Scotland Glasgow and Fife Scotland Scotland and Islands SNP LD Lab Con 65+ 55-64 45-54 35-44 25-34 16-24 Female Male 3983 7824224433123318 145842 172039514433 13107 93 200Unweighted Total 3481 8527212824133733 166444 142729473928 3099 102 200Weighted Total 2039 351314111520 2619 1021162122 47 47 941 or more GCSEs (any 58.6%47.9% 41.7%48.5%36.8%49.2%44.7%51.0%39.0%58.8% 49.2%40.2%90.9%42.1% 72.7%77.9%56.4%44.0%56.3%29.6% 19.7%48.0% 46.2% 47.1%grade) / 1-4 O- Levels (pass) / 1-4 Standard Grades 1442 50141314142314 3826 13261720 2451 55 1065+ GCSEs (grades A*- 41.4%52.1% 58.3%51.5%63.2%50.8%55.3%49.0%61.0%41.2% 50.8%59.8%9.1%57.9% 27.3%22.1%43.6%56.0%43.7%70.4% 80.3%52.0% 53.8% 52.9%C) / 5+ O-Level (pass) / 5+ Standard Grades (pass) 3481 8527212824133733 166444 142729473928 3099 102 200SIGMA 100.0% 100.0% 100.0% 100.0% 100.0% 100.0% 100.0% 100.0% 100.0% 100.0% 100.0% 100.0% 100.0% 100.0% 100.0% 100.0% 100.0% 100.0% 100.0% 100.0% 100.0% 100.0% 100.0% 100.0%Page 11Scottish 2nd Debate Reactions Poll Prepared by Survation on behalf of the Daily Mail28 Aug 2014Table 8Q6.2. You selected GCSEs/O-Levels/Standard Grades. What is your highest level of attainment for your particular qualification?Base : All Answering Prepared by Survation on behalf of the Daily Mail Page 11 Referendum Vote ScotRegion 2011 Holyrood Vote Age Gender Total Mid North East West Scotland Central South Highlands Undecided No Yes Scotland Lothian Scotland Glasgow and Fife Scotland Scotland and Islands SNP LD Lab Con 65+ 55-64 45-54 35-44 25-34 16-24 Female Male 1557 521919242711 154025 101229302123 1168 58 126Unweighted Total 1256 51221816201210 163829 1818261821 1968 51 120Weighted Total 14 11 5442 -3-335 29 7 16 10.8%7.8% 20.6%5.9%9.2%4.3%8.6%31.8%19.5% 30.1%11.0%42.6%8.2% 14.5%12.5%16.3%24.2% 11.9%13.1% 13.9% 13.5% 13 17 1112 336677 20 16 36 41.3%23.9% 32.3%32.5%26.3%38.4%30.6%45.1%35.4%31.1% 6.4%28.8%4.9%41.5% 32.3%16.7%33.8%22.0%36.8%33.2% 39.8%29.7% 30.4% 30.0% 18 13 15 1013 18 15 34 23.4%32.8% 25.3%32.3%25.8%26.3%43.4%15.8%11.0% 39.4%39.0%52.5%18.5% 36.5%54.0%30.8%48.3%8.7%9.9% 13.8%27.0% 30.1% 28.3% 20 11 48-9 336577 21 13 344+ 24.5%35.4% 21.9%29.3%38.7%31.0%17.4%7.2%34.1%68.9% 24.1%21.2%31.8% 31.2%14.7%35.4%17.2%38.2%32.7% 34.5%30.1% 25.6% 28.2% 1256 51221816201210 163829 1818261821 1968 51 120SIGMA 100.0% 100.0% 100.0% 100.0% 100.0% 100.0% 100.0% 100.0% 100.0% 100.0% 100.0% 100.0% 100.0% 100.0% 100.0% 100.0% 100.0% 100.0% 100.0% 100.0% 100.0% 100.0% 100.0% 100.0%Page 12Scottish 2nd Debate Reactions Poll Prepared by Survation on behalf of the Daily Mail28 Aug 2014Table 9Q6.3. You selected AS-Levels / Scottish Highers. How many do you have?Base : All Answering Prepared by Survation on behalf of the Daily Mail Page 12 Referendum Vote ScotRegion 2011 Holyrood Vote Age Gender Total Mid North East West Scotland Central South Highlands Undecided No Yes Scotland Lothian Scotland Glasgow and Fife Scotland Scotland and Islands SNP LD Lab Con 65+ 55-64 45-54 35-44 25-34 16-24 Female Male 36 191112 11 1414 1634 28 62Unweighted Total 44 23101114 12 1414 3042 31 73Weighted Total 19 74111522 -4-1 31-335 10 6 16 14.4%19.8% 30.4%68.8%11.4%15.8%5.2%37.3%24.4%20.2% 37.1%13.3% 37.2%13.1%22.7%60.8%34.7% 16.3%24.2% 19.9% 22.4% 15 41235133 3212 432812 68 13 21 37.9%34.3% 19.6%10.4%16.8%37.8%44.5%8.0%37.4%37.1% 51.1%15.5%66.3%26.9% 50.3%45.2%38.9%55.6%21.4%16.9% 18.5%18.9% 42.7% 29.1% 11 5*34343- *3*3 1-1215 13 5 18 47.7%25.4% 19.9%3.2%35.9%46.4%24.7%28.3%38.2% 2.7%25.6%33.7%33.4% 6.3%32.5%13.5%17.8%37.9% 28.7%30.5% 16.0% 24.3% -9 713-34-4 33-2 1311-1 1111 7 184+ 20.4% 30.1%17.6%35.9%25.7%26.4%42.6% 46.2%21.8%26.5% 6.3%41.7%28.6%8.2%10.5% 36.5%26.3% 21.4% 24.2% 44 23101114 12 1414 3042 31 73SIGMA 100.0% 100.0% 100.0% 100.0% 100.0% 100.0% 100.0% 100.0% 100.0% 100.0% 100.0% 100.0% 100.0% 100.0% 100.0% 100.0% 100.0% 100.0% 100.0% 100.0% 100.0% 100.0% 100.0% 100.0%Page 13Scottish 2nd Debate Reactions Poll Prepared by Survation on behalf of the Daily Mail28 Aug 2014Table 10Q6.4. You selected A-Levels / Advanced Highers. How many do you have?Base : All Answering Prepared by Survation on behalf of the Daily Mail Page 13 Referendum Vote ScotRegion 2011 Holyrood Vote Age Gender Total Mid North East West Scotland Central South Highlands Undecided No Yes Scotland Lothian Scotland Glasgow and Fife Scotland Scotland and Islands SNP LD Lab Con 65+ 55-64 45-54 35-44 25-34 16-24 Female Male 135451 3991241532011709711364 7929754194 105147219200183183 69553 448 1001Unweighted Total 120459 405144136130129128122122 8931154217 95203153180167153 144516 485 1001Weighted Total 45167 18268644251594342 3412817100 364810810186 53176 228 404Full-time employment 37.6%36.3% 45.0%46.9%47.2%32.2%39.9%45.9%35.6%34.6% 38.6%41.2%31.2%46.0% 37.4%4.2%31.2%59.7%60.6%56.3% 36.5%34.2% 46.9% 40.4% 2351 5421122621111810 113629 1425242821 1797 32 129Part-time employment 18.8%11.2% 13.3%14.9%8.7%19.6%16.5%8.4%14.4%7.8% 12.1%11.6%7.3%13.3% 9.4%7.0%16.2%13.4%16.7%13.5% 11.8%18.8% 6.6% 12.9% 2035 5912161315123012 3716 15292428 2156 61 117Unemployed 16.9%7.5% 14.7%8.0%11.8%10.2%11.7%9.2%24.5%9.9% 7.9%11.9%11.7%7.2% 3.1%10.1%16.2%14.1%18.3% 14.3%10.9% 12.5% 11.7% 41 19121410 69-7 ---3*9 5455 11 66Student 4.0%9.0% 4.6%2.3%6.4%9.3%10.6%7.9%4.0%6.3% 6.5%2.7%3.3% 1.5%0.3%6.1% 37.3%10.7% 2.2% 6.6% 27165 9140353728372650 311022765 48181651614 131 154 285Retired/other 22.7%36.0% 22.4%28.0%25.9%28.7%21.3%28.6%21.5%41.3% 34.9%32.6%49.8%30.1% 50.1%88.8%42.6%9.1%8.3%5.7% 25.4% 31.7% 28.5% 120459 405144136130129128122122 8931154217 95203153180167153 144516 485 1001SIGMA 100.0% 100.0% 100.0% 100.0% 100.0% 100.0% 100.0% 100.0% 100.0% 100.0% 100.0% 100.0% 100.0% 100.0% 100.0% 100.0% 100.0% 100.0% 100.0% 100.0% 100.0% 100.0% 100.0% 100.0%Page 14Scottish 2nd Debate Reactions Poll Prepared by Survation on behalf of the Daily Mail28 Aug 2014Table 11Q7. What is your current employment status?Base : All Respondents Prepared by Survation on behalf of the Daily Mail Page 14 Referendum Vote ScotRegion 2011 Holyrood Vote Age Gender Total Mid North East West Scotland Central South Highlands Undecided No Yes Scotland Lothian Scotland Glasgow and Fife Scotland Scotland and Islands SNP LD Lab Con 65+ 55-64 45-54 35-44 25-34 16-24 Female Male 80232 2397890108100566029 4016425119 5618101146138127 31301 260 561Unweighted Total 67218 23689766772706152 4516421129 452373132129106 70273 259 532Weighted Total 39139 14252523945364037 281011477 372248828068 29145 183 328Private sector 58.6%63.7% 60.0%58.5%68.0%57.3%62.1%51.1%66.2%70.6% 62.3%61.5%66.7%60.0% 83.2%96.5%66.6%62.0%61.8%63.6% 41.0%53.3% 70.4% 61.6% 2879 9437242927342115 176352 24504939 41128 77 204Public sector 41.4%36.3% 40.0%41.5%32.0%42.7%37.9%48.9%33.8%29.4% 37.7%38.5%33.3%40.0% 16.8%3.5%33.4%38.0%38.2%36.4% 59.0%46.7% 29.6% 38.4% 67218 23689766772706152 4516421129 452373132129106 70273 259 532SIGMA 100.0% 100.0% 100.0% 100.0% 100.0% 100.0% 100.0% 100.0% 100.0% 100.0% 100.0% 100.0% 100.0% 100.0% 100.0% 100.0% 100.0% 100.0% 100.0% 100.0% 100.0% 100.0% 100.0% 100.0%Page 15Scottish 2nd Debate Reactions Poll Prepared by Survation on behalf of the Daily Mail28 Aug 2014Table 12Q8. Are you currently employed in the public or private sector?Base : Total Answering Prepared by Survation on behalf of the Daily Mail Page 15 Referendum Vote ScotRegion 2011 Holyrood Vote Age Gender Total Mid North East West Scotland Central South Highlands Undecided No Yes Scotland Lothian Scotland Glasgow and Fife Scotland Scotland and Islands SNP LD Lab Con 65+ 55-64 45-54 35-44 25-34 16-24 Female Male 135451 3991241532011709711364 7929754194 105147219200183183 69553 448 1001Unweighted Total 120459 405144136130129128122122 8931154217 95203153180167153 144516 485 1001Weighted Total 72403 34412511810810010910583 7127942196 87184138148134110 104426 393 81910 - would 59.9%87.8% 85.0%86.9%86.9%82.6%77.3%85.3%86.3%67.7% 79.2%89.6%77.4%90.2% 90.7%90.6%90.1%82.3%80.1%72.0% 72.4%82.5% 81.0% 81.8%definitely vote 1030 2724 102014 13141015 19 48 67 8.2%6.6% 6.6%3.6%4.3%5.8%5.4%4.6%1.4%19.4% 11.1%6.6%11.6%6.3% 8.3%6.6%3.9%8.0%6.1%9.7% 5.4%3.6% 9.9% 6.7% 14 16 1616 -53467 1316 22 37 6.1%3.1% 4.0%4.8%2.7%5.2%5.6%4.8%4.6% 1.2%1.9%1.6%3.0% 2.3%1.9%2.3%3.4%4.3% 9.2%3.0% 4.5% 3.7% 33 72212-42 13-1 1-1237 -8 5 13 2.5%0.7% 1.7%1.4%1.5%0.7%1.4%2.9%1.4% 1.3%0.9%0.5% 1.0%0.4%1.1%2.1%4.7% 1.6% 1.0% 1.3% 13 2-131-1- --1- ---111 33 3 66 1.2%0.6% 0.5%0.6%2.4%0.9%0.6% 1.1% 0.4%0.7%0.9% 1.8%0.5% 0.7% 0.6% 19 64137-47 122- --4596 24 4 28 15.8%0.6% 1.5%2.8%1.0%2.4%5.7%3.4%5.4% 1.7%0.6%4.0% 2.9%2.8%5.3%4.0% 2.5%4.6% 0.9% 2.8% 4- ------1- 3--- -----1 33 1 44 3.0% 0.8% 3.0% 0.6% 1.8%0.5% 0.2% 0.4% 1- -1------ ---- ---1-- -1 - 13 0.7% 0.6% ---- 0.5% 0.2% - 0.1% 3- 2--*-1-1 2-2- --*1-1 25 - 52 2.2% 0.6%0.3%0.7%1.1% 2.6%4.3% 0.2%0.7%0.6% 1.6%1.0% - 0.5% *3 1-2*11-- ---- --*-11 24 * 41 0.4%0.6% 0.2%1.3%0.3%0.9%0.7% ---- 0.3%0.8%0.5% 1.2%0.7% 0.1% 0.4% -- --2*35-6 -1-- -1*324 69 9 170 - would not vote -- 1.8%0.3%2.6%3.8%5.0% 0.4% 0.6%0.2%1.8%1.5%2.7% 4.1%1.7% 1.8% 1.7% 120459 405144136130129128122122 8931154217 95203153180167153 144516 485 1001SIGMA 100.0% 100.0% 100.0% 100.0% 100.0% 100.0% 100.0% 100.0% 100.0% 100.0% 100.0% 100.0% 100.0% 100.0% 100.0% 100.0% 100.0% 100.0% 100.0% 100.0% 100.0% 100.0% 100.0% 100.0%Page 16Scottish 2nd Debate Reactions Poll Prepared by Survation on behalf of the Daily Mail28 Aug 2014Table 13Q9. As you may know, a referendum on independence will be held in Scotland on 18th September this year. On a scale of 0 to 10, how likely will you be to vote in this referendum?Base : All Respondents Prepared by Survation on behalf of the Daily Mail Page 16 Referendum Vote ScotRegion 2011 Holyrood Vote Age Gender Total Mid North East West Scotland Central South Highlands Undecided No Yes Scotland Lothian Scotland Glasgow and Fife Scotland Scotland and Islands SNP LD Lab Con 65+ 55-64 45-54 35-44 25-34 16-24 Female Male 135451 3991241512001659211361 7929654194 105146218197180177 67542 443 985Unweighted Total 120459 405144134130126123122116 8931054217 95202153177165149 138507 476 984Weighted Total -- 40561475452565345 3722566 6459827269 59191 214 405Yes -- 100.0%42.6%35.1%41.4%41.2%45.3%43.6%38.4% 41.7%72.5%14.0%30.2% 2.7%31.6%38.7%46.1%43.9%46.5% 42.4%37.6% 44.9% 41.1% 459 68775554564859 425639132 8712377696859 63238 221 459No 100.0% 47.1%57.9%42.5%42.8%45.3%39.4%50.9% 47.0%18.0%71.1%60.5% 91.6%60.9%50.4%38.9%41.4%39.5% 45.6%47.0% 46.3% 46.7% 120 152120122112 102920 1517272421 1778 42 120Undecided 100.0% 10.3%7.0%16.1%16.1%9.4%17.0%10.7% 11.3%9.5%14.8%9.3% 5.7%7.6%10.9%15.0%14.7%13.9% 12.0%15.4% 8.8% 12.2% 120459 405144134130126123122116 8931054217 95202153177165149 138507 476 984SIGMA 100.0% 100.0% 100.0% 100.0% 100.0% 100.0% 100.0% 100.0% 100.0% 100.0% 100.0% 100.0% 100.0% 100.0% 100.0% 100.0% 100.0% 100.0% 100.0% 100.0% 100.0% 100.0% 100.0% 100.0%Page 17Scottish 2nd Debate Reactions Poll Prepared by Survation on behalf of the Daily Mail28 Aug 2014Table 14Referendum Voting Table, weighted by normal weightingQ10. In the referendum, voters will be asked, ‘Should Scotland be an independent country'. If this referendum were held today, do you think you would vote 'Yes’ or 'No'?Base : Respondents likely to vote Prepared by Survation on behalf of the Daily Mail Page 17 Referendum Vote ScotRegion 2011 Holyrood Vote Age Gender Total Mid North East West Scotland Central South Highlands Undecided No Yes Scotland Lothian Scotland Glasgow and Fife Scotland Scotland and Islands SNP LD Lab Con 65+ 55-64 45-54 35-44 25-34 16-24 Female Male 135451 3991241512001659211361 7929654194 105146218197180177 67542 443 985Unweighted Total 106469 409146136130124126123114 8732053225 99210156178163145 133501 484 985Weighted Total -- 40964485552575445 3623368 6762847269 56191 218 409Yes -- 100.0%43.6%35.1%42.2%42.1%45.4%43.8%39.2% 41.0%72.9%9.4%30.1% 2.4%31.8%39.6%47.2%44.0%47.6% 42.1%38.2% 45.0% 41.6% 469 70795654584960 435740136 9112780716859 64243 227 469No 100.0% 48.0%58.1%42.8%43.9%45.9%40.2%52.6% 49.5%17.9%75.0%60.6% 91.8%60.7%51.0%40.1%42.0%40.6% 47.7%48.4% 46.8% 47.6% 106 1219171120 3021 1615232317 1467 40 106Undecided 100.0% 8.4%6.8%15.0%14.0%8.7%16.0%8.1% 9.5%9.3%15.6%9.3% 5.8%7.5%9.3%12.7%14.0%11.8% 10.2%13.3% 8.2% 10.8% 106469 409146136130124126123114 8732053225 99210156178163145 133501 484 985SIGMA 100.0% 100.0% 100.0% 100.0% 100.0% 100.0% 100.0% 100.0% 100.0% 100.0% 100.0% 100.0% 100.0% 100.0% 100.0% 100.0% 100.0% 100.0% 100.0% 100.0% 100.0% 100.0% 100.0% 100.0%Page 18Scottish 2nd Debate Reactions Poll Prepared by Survation on behalf of the Daily Mail28 Aug 2014Table 15Referendum Voting Table, weighted by likelihood to vote in referendumQ10. In the referendum, voters will be asked, ‘Should Scotland be an independent country'. If this referendum were held today, do you think you would vote 'Yes’ or 'No'?Base : Respondents likely to vote Prepared by Survation on behalf of the Daily Mail Page 18 Referendum Vote ScotRegion 2011 Holyrood Vote Age Gender Total Mid North East West Scotland Central South Highlands Undecided No Yes Scotland Lothian Scotland Glasgow and Fife Scotland Scotland and Islands SNP LD Lab Con 65+ 55-64 45-54 35-44 25-34 16-24 Female Male 135451 3991241532011709711364 7929754194 105147219200183183 69553 448 1001Unweighted Total 120459 405144136130129128122122 8931154217 95203153180167153 144516 485 1001Weighted Total 71330 31410610010188967990 5731154217 9518213114512991 38321 396 717Yes, I voted in the 59.1%72.0% 77.6%73.3%73.2%77.8%68.3%75.1%64.5%74.1% 63.8%100.0%100.0%100.0% 100.0%89.4%85.8%80.4%77.4%59.6% 26.5%62.2% 81.6% 71.6%2011 Scottish Parliament election 35107 8132322333243829 26 1516262950 102158 79 237No, I did not vote 29.5%23.4% 19.9%22.0%23.7%17.7%25.2%19.1%31.3%24.0% 28.8% 7.3%10.1%14.3%17.5%32.6% 70.7%30.6% 16.3% 23.7%in the 2011 Scottish Parliament election 1421 10 7--- 1012 37 10 47Can't remember 11.5%4.6% 2.4%4.7%3.1%4.6%6.5%5.8%4.1%1.9% 7.4% 3.3%4.1%5.3%5.1%7.8% 2.7%7.2% 2.1% 4.7% 120459 405144136130129128122122 8931154217 95203153180167153 144516 485 1001SIGMA 100.0% 100.0% 100.0% 100.0% 100.0% 100.0% 100.0% 100.0% 100.0% 100.0% 100.0% 100.0% 100.0% 100.0% 100.0% 100.0% 100.0% 100.0% 100.0% 100.0% 100.0% 100.0% 100.0% 100.0%Page 19Scottish 2nd Debate Reactions Poll Prepared by Survation on behalf of the Daily Mail28 Aug 2014Table 16Q11. In the May 2011 election for the Scottish Parliament, half of Scottish people voted and the other half did not vote. Can you remember whether you voted in that particular election?Base : All Respondents Prepared by Survation on behalf of the Daily Mail Page 19 Referendum Vote ScotRegion 2011 Holyrood Vote Age Gender Total Mid North East West Scotland Central South Highlands Undecided No Yes Scotland Lothian Scotland Glasgow and Fife Scotland Scotland and Islands SNP LD Lab Con 65+ 55-64 45-54 35-44 25-34 16-24 Female Male 77330 30888117155117717147 5129754194 105128181157134102 15354 363 717Unweighted Total 71330 31410610010188967990 5731154217 9518213114512991 38321 396 717Weighted Total 20132 6623303528313029 11217 4643424829 10108 110 217Labour 28.4%39.8% 20.9%21.8%30.1%34.9%31.5%31.8%38.0%32.5% 20.1%100.0% 25.0%33.0%28.9%36.9%31.3% 27.2%33.6% 27.7% 30.3% 87 1419111419 9--- 9538191316 41 55 95Conservative 7.7%26.5% 0.8%13.2%19.3%11.0%15.9%5.7%4.4%20.6% 16.6% 100.0%20.7%14.4%9.3%12.6%9.9% 12.7% 13.8% 13.3% 2956 22554404637424029 23311 7655704742 20121 191 311Scottish National 41.4%16.9% 71.7%51.5%40.6%45.2%42.2%44.0%50.2%32.2% 40.1%100.0% 41.9%42.1%48.5%36.6%46.4% 52.2%37.6% 48.2% 43.4%Party (SNP) 39 1510 54 22 26 29 54Liberal Democrat 11.3%11.7% 2.4%7.8%4.8%4.6%3.9%15.3%1.1%10.5% 14.1%100.0% 12.0%6.7%6.1%6.2%4.7% 6.0%8.0% 7.2% 7.6% 13 3111211* 1--- -13211 -4 4 Another Party 1.6%0.9% 1.0%0.6%0.8%0.8%2.1%0.6%1.3%0.5% 2.5% 0.3%2.1%1.3%0.8%1.4% 1.1% 1.0% 1.0% 14 10 4--- --2896 23 8 31Don’t remember 9.5%4.3% 3.2%5.0%4.6%3.6%4.4%2.6%5.1%3.7% 6.7% 1.7%5.8%7.0%6.3% 14.6%7.0% 2.1% 4.3% 71330 31410610010188967990 5731154217 9518213114512991 38321 396 717SIGMA 100.0% 100.0% 100.0% 100.0% 100.0% 100.0% 100.0% 100.0% 100.0% 100.0% 100.0% 100.0% 100.0% 100.0% 100.0% 100.0% 100.0% 100.0% 100.0% 100.0% 100.0% 100.0% 100.0% 100.0%Page 20Scottish 2nd Debate Reactions Poll Prepared by Survation on behalf of the Daily Mail28 Aug 2014Table 17Q12. In the May 2011 Scottish Parliament election you had two votes. Your first vote was for a single person to represent your constituency in the Scottish Parliament.Which party did you vote for with that first, constituency vote?Base : Respondents voted in the 2011 Scottish Parliament election Prepared by Survation on behalf of the Daily Mail Page 20 Referendum Vote ScotRegion 2011 Holyrood Vote Age Gender Total Mid North East West Scotland Central South Highlands Undecided No Yes Scotland Lothian Scotland Glasgow and Fife Scotland Scotland and Islands SNP LD Lab Con 65+ 55-64 45-54 35-44 25-34 16-24 Female Male 135451 3991241532011709711364 7929754194 105147219200183183 69553 448 1001Unweighted Total 120459 405144136130129128122122 8931154217 95203153180167153 144516 485 1001Weighted Total 60302 323102899083869387 5724946162 74154108131111103 81332 355 687Yes 50.3%65.8% 79.7%70.8%65.1%69.1%64.6%67.0%76.5%71.4% 63.7%79.9%85.8%74.3% 77.1%75.7%70.7%72.5%66.1%67.1% 56.3%64.3% 73.2% 68.6% 60157 8242474046422935 326356 224945505750 63184 130 314No 49.7%34.2% 20.3%29.2%34.9%30.9%35.4%33.0%23.5%28.6% 36.3%20.1%14.2%25.7% 22.9%24.3%29.3%27.5%33.9%32.9% 43.7%35.7% 26.8% 31.4% 120459 405144136130129128122122 8931154217 95203153180167153 144516 485 1001SIGMA 100.0% 100.0% 100.0% 100.0% 100.0% 100.0% 100.0% 100.0% 100.0% 100.0% 100.0% 100.0% 100.0% 100.0% 100.0% 100.0% 100.0% 100.0% 100.0% 100.0% 100.0% 100.0% 100.0% 100.0%Page 21Scottish 2nd Debate Reactions Poll Prepared by Survation on behalf of the Daily Mail28 Aug 2014Table 18Q13. Have you watched any of the Scottish independence debate that took place between Alex Salmond and Alistair Darling this week?Base : All Respondents Prepared by Survation on behalf of the Daily Mail Page 21 Referendum Vote ScotRegion 2011 Holyrood Vote Age Gender Total Mid North East West Scotland Central South Highlands Undecided No Yes Scotland Lothian Scotland Glasgow and Fife Scotland Scotland and Islands SNP LD Lab Con 65+ 55-64 45-54 35-44 25-34 16-24 Female Male 62158 8736495961363018 31621049 233870566163 32204 116 320Unweighted Total 59155 8240474045422935 326356 204845505750 63183 128 312Weighted Total 30100 5728322626281717 204438 153534343327 31113 81 195Yes 50.8%64.5% 69.8%69.8%66.4%65.8%57.1%66.8%60.1%49.3% 61.1%70.3%100.0%67.4% 75.1%73.1%76.3%68.5%59.0%54.3% 49.1%61.9% 63.2% 62.4% 2955 2512161419141118 131918 1311162323 3270 47 117No 49.2%35.5% 30.2%30.2%33.6%34.2%42.9%33.2%39.9%50.7% 38.9%29.7%32.6% 24.9%26.9%23.7%31.5%41.0%45.7% 50.9%38.1% 36.8% 37.6% 59155 8240474045422935 326356 204845505750 63183 128 312SIGMA 100.0% 100.0% 100.0% 100.0% 100.0% 100.0% 100.0% 100.0% 100.0% 100.0% 100.0% 100.0% 100.0% 100.0% 100.0% 100.0% 100.0% 100.0% 100.0% 100.0% 100.0% 100.0% 100.0% 100.0%Page 22Scottish 2nd Debate Reactions Poll Prepared by Survation on behalf of the Daily Mail28 Aug 2014Table 19Q14. Have you seen / read / heard anything about the debate since Monday?Base : Total Answering Prepared by Survation on behalf of the Daily Mail Page 22 Referendum Vote ScotRegion 2011 Holyrood Vote Age Gender Total Mid North East West Scotland Central South Highlands Undecided No Yes Scotland Lothian Scotland Glasgow and Fife Scotland Scotland and Islands SNP LD Lab Con 65+ 55-64 45-54 35-44 25-34 16-24 Female Male 105397 3791141401821448510255 6728254178 100135203185159154 53478 411 889Unweighted Total 91404 380132120116110114111104 7629354199 90190143165144130 112446 438 884Weighted Total 60149 35188707564737273 5025925106 33109871209485 70269 297 566Alex Salmond 65.7%37.0% 92.4%66.6%58.5%64.3%58.2%64.2%64.8%70.4% 65.9%88.3%46.5%53.0% 36.5%57.1%61.2%73.2%65.1%65.5% 62.7%60.4% 67.7% 64.0% 124 1315252023121720 13111448 414124192220 2060 85 144Alistair Darling 8.7%30.7% 3.3%11.6%20.7%17.4%20.5%10.5%15.4%18.9% 16.6%3.6%26.5%24.1% 45.0%21.4%16.6%11.5%15.0%15.0% 17.8%13.3% 19.4% 16.3% 23131 1629252123292211 13241546 174132252925 22117 57 174Don't know 25.6%32.3% 4.3%21.8%20.7%18.3%21.3%25.3%19.8%10.7% 17.6%8.1%27.0%22.9% 18.5%21.6%22.2%15.3%19.9%19.5% 19.4%26.3% 12.9% 19.7% 91404 380132120116110114111104 7629354199 90190143165144130 112446 438 884SIGMA 100.0% 100.0% 100.0% 100.0% 100.0% 100.0% 100.0% 100.0% 100.0% 100.0% 100.0% 100.0% 100.0% 100.0% 100.0% 100.0% 100.0% 100.0% 100.0% 100.0% 100.0% 100.0% 100.0% 100.0%Page 23Scottish 2nd Debate Reactions Poll Prepared by Survation on behalf of the Daily Mail28 Aug 2014Table 20Q15. Who do you think won this debate?Base : Total Answering Prepared by Survation on behalf of the Daily Mail Page 23 Referendum Vote ScotRegion 2011 Holyrood Vote Age Gender Total Mid North East West Scotland Central South Highlands Undecided No Yes Scotland Lothian Scotland Glasgow and Fife Scotland Scotland and Islands SNP LD Lab Con 65+ 55-64 45-54 35-44 25-34 16-24 Female Male 105397 3791141401821448510255 6728254178 100135203185159154 53478 411 889Unweighted Total 91404 380132120116110114111104 7629354199 90190143165144130 112446 438 884Weighted Total 32 17637202727344220 1110541 2920384345 43122 96 217Made me more likely 35.1%2.3% 46.3%28.2%16.8%23.2%24.5%29.5%37.5%19.6% 13.8%36.0%13.4%20.4% 7.0%15.1%14.1%22.8%29.9%34.6% 38.4%27.3% 21.9% 24.6%to vote ‘Yes’ 100 111419171418 151536 253817131316 1552 60 113Made me more likely 8.5%24.8% 1.2%8.6%11.3%16.3%15.1%4.5%12.6%17.4% 19.4%5.1%11.8%18.0% 27.2%20.1%12.2%7.9%8.9%12.7% 13.1%11.7% 13.8% 12.7%to vote ‘No’ 51295 19983867066755566 5117341123 601231051148869 54272 282 554Not affected the way 56.4%72.9% 52.5%63.2%71.8%60.5%60.4%66.0%49.9%63.0% 66.8%59.0%74.8%61.5% 65.9%64.8%73.8%69.3%61.2%52.7% 48.5%61.0% 64.3% 62.7%I intend to vote 91404 380132120116110114111104 7629354199 90190143165144130 112446 438 884SIGMA 100.0% 100.0% 100.0% 100.0% 100.0% 100.0% 100.0% 100.0% 100.0% 100.0% 100.0% 100.0% 100.0% 100.0% 100.0% 100.0% 100.0% 100.0% 100.0% 100.0% 100.0% 100.0% 100.0% 100.0%Page 24Scottish 2nd Debate Reactions Poll Prepared by Survation on behalf of the Daily Mail28 Aug 2014Table 21Q16. How, if at all, has the debate changed the way you intend to vote in the referendum?Base : Total Answering Prepared by Survation on behalf of the Daily Mail Page 24