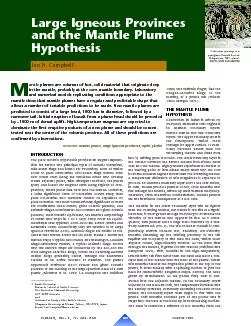
/
The plate tectonic hypothesis provides an elegant explana-tion for Ear The plate tectonic hypothesis provides an elegant explana-tion for Ear

The plate tectonic hypothesis provides an elegant explana-tion for Ear - PDF document

sherrill-nordquist
sherrill-nordquist . @sherrill-nordquist
Follow
408 views
Uploaded On 2015-08-31

The plate tectonic hypothesis provides an elegant explana-tion for Ear - PPT Presentation

1shows the THE MANTLE PLUMEHYPOTHESIS Convection in fluids is driven bybuoyancy anomalies that originatein thermal boundary layersEarth ID: 119108

1shows the THE MANTLE PLUMEHYPOTHESIS Convection

Share:

Link:

Embed:

Download Presentation from below link

Download Pdf The PPT/PDF document "The plate tectonic hypothesis provides a..." is the property of its rightful owner. Permission is granted to download and print the materials on this web site for personal, non-commercial use only, and to display it on your personal computer provided you do not modify the materials and that you retain all copyright notices contained in the materials. By downloading content from our website, you accept the terms of this agreement.


Presentation Transcript

The plate tectonic hypothesis provides an elegant explana-tion for EarthÕs two principal types of basaltic volcanism,mid-ocean ridge and island arc volcanism, both of whichoccur at plate boundaries. Mid-ocean ridge basalts formnew ocean crust along the tensional zones that developwhere adjacent plates, with divergent motions, are pulledapart, and island arc magmas form along regions of com-pression, where plates sink back into the mantle. However,third significant form of volcanism occurs away fromplate boundaries and therefore cannot be explained byplate tectonics. The most volumetrically significant of theseare continental flood basalts, giant oceanic plateaus, andaseismic ridges. Continental flood basalts and giant oceanicplateaus, their oceanic equivalent, are massive outpouringsof basalt that erupt in 1 to 5 Myr. They cover an equidi-mensional area typically 2000Ð2500 km across (White andMcKenzie 1989). Collectively they are referred to as LargeLIPsLIPscanoes that stretch across the sea floor. F 1shows the THE MANTLE PLUMEHYPOTHESIS Convection in fluids is driven bybuoyancy anomalies that originatein thermal boundary layers.EarthÕs mantle has two boundarylayers. The upper boundary layer isthe lithosphere, which coolsthrough its upper surface. It even-tually becomes denser than theunderlying mantle and sinks backinto it, driving plate tectonics. The lower boundary layer isthe contact between the EarthÕs molten ironÐnickel outercore and the mantle. High-pressure experimental studies ofthe melting point of ironÐnickel alloys show that the coreis several hundred degrees hotter than the overlying mantle.temperature difference of this magnitude is expected toproduce an unstable boundary layer above the core which,in turn, should produce plumes of hot, solid material thatrise through the mantle, driven by their thermal buoyancy.Therefore, from theoretical considerations, mantle plumesare the inevitable consequence of a hot core. The material in the lower boundary layer will be lighterthan the overlying mantle, but before it can rise at a signif-icant rate, it must gather enough buoyancy to overcome theviscosity of the mantle that opposes its rise. As a conse-quence, new plumes have a large head followed by a rela-tively narrow tail (F 2). The tail or feeder conduit is com- V Ian H. Campbell 1Earth Chemistry plumes are columns of hot, solid material that originate deepin the mantle, probably at the coreÐmantle boundary. Laboratorymantle show that mantle plumes have a regular and predictable shape thatpredicted to consist of a large head, 1000 km in diameter, followed by a-trated near the centre of the volcanic province. All of these predictions are mantle plume, large igneous provinces, uplift, picrite olumnar jointing in apostglacial basalt flow atP C Large Igneous Provincesand the Mantle PlumeHypothesis plume source region and cooler entrained mantle (F 2 When the plume head reaches the top of its ascent, it flat-tens to form a disk with a diameter twice that of the head(F 2 ). Note that growth of the plume head as it risesthrough the mantle occurs because mantle in the plume tailrises faster than the plume head, which is a direct conse-quence of the strong temperature dependence of the mantleÕsviscosity. PREDICTIONS AND OBSERVATIONS The plume hypothesis makes the following testablepredictions. bya small tail Flood basalts and oceanic plateaus, the oceanic equivalentflood basalts, are the first eruptive products of a newmantle plume. The volumes of basalt produced during19891989shown that eruption rates of flood basalts are one to twoorders of magnitude higher than those of the associatedocean island chain, which connects them to the currentposition of the plume. This observation fits well with theplume hypothesis, which attributes the high eruption ratesof flood basalts to melting of plume heads and the lowereruption rates of ocean island chains to melting of narrowerplume tails. 2000 to 2500km in diameter DDature difference between the plume and the adjacent man-tle ( the plumeÕs excess temperature), its buoyancy flux(Q), the kinematic viscosity of the lower mantle ( ),and its ), as described in equation (1) =Q where g is gravitational acceleration, is the coefficient ofthermal expansion of the mantle, and is its thermal con-Griffiths and Campbell 1990Griffiths and Campbell 1990plume height of rise is raised to the power 3/5, whereasmost other terms are raised to the power 1/5. Therefore theheight of rise of the plume, which in the case of Earth is thedepth of the mantle, is the dominant factor influencing thesize of a plume head. If of a plume is assumed to be300¡C and its buoyancy flux to vary between 3 4 s ,the calculated diameter of a plume head orig- ically at least twice as thick as normal oceanic crust. Otherexamplesof plume-related thickened oceanic crust are the Plumes must originate from a hot boundarylayer, probably the coreÐmantle boundary The obviousway to show that plumes originate from the Map of the western Indian Ocean showing the distributionof volcanic rocks associated with the RŽunionÐDeccanplume. The Seychelles were part of the Deccan Traps prior to separationcaused by spreading on the CarlsbergÐCentral Indian Ridge. Note thatthe Deccan Traps are connected via the 200Ð300km wide ChagosÐLacadive Ridge, across the Carlsberg Ridge spreading center, to theMascarene Plateau and eventually to RŽunion Island, the current posi-tion of the plume. Between 60 and 40 Ma, the RŽunion plume waslocated under the Carlsberg Ridge. It produced a volcanic ridge on bothsides of the spreading center, before leaving the ridge and appearing tobacktrack on itself towards RŽunion, which is its current position (adaptedfrom White and McKenzie 1989). the upper mantle, which may explain the discrepancies20042004expected from plume theory. Nevertheless the Montelli etal. method shows great promise and may eventually allowunambiguous imaging of plume tails in both the upper andlower mantles. Both heads and tails should erupt high-temperature picrites of mantle plumes can be estimated from the maxi-mum MgO content of their erupted magmas because, fordry melts, there is a linear relationship between the MgOcontent and magma temperature. As a rough rule, a 4 wt%increase in MgO in the melt equates to a 100¡C increase insee glossarysee glossaryhigh-Mg basaltichigh-Mg basalticliquids varies between 18 and 22 wt%, suggesting that thetemperature excess for mantle plumes is between 150¡C and250¡C. Examples of volcanic provinces that have beenattributed to plumes and that include high-MgO picriticmelts are RŽunionÐDeccan, Paran‡, North Atlantic Province,Karoo, Emeishan, GalapagosÐCaribbean, and HawaiÔi. The temperature excess of a plume head ishighest at the centre of the head and decreases When new oceanic crust opens up above a plume head, thethickness of the oceanic crust produced is dependent on thetemperature of the mantle that is drawn into the new mid-ocean ridge spreading centre. The plume hypothesis pre-dicts that the temperature of a plume head should be high-est near the plume axis, where the tail continues to risethrough the centre of the head (F 2). At the center of thehead, is expected to be 300 ±100ꄀC. The in theremainder of the head, which is a mixture of hot materialfrom the boundary layer source and cooler entrained lowermantle, varies with the plume buoyancy flux but must beless than at the centre. For typical plume buoyancy fluxes,the average 20032003seismic reflection and refraction data, obtained from fourtraverses located between the plume head and its margin, todetermine the thickness of the first oceanic crust to formwhen the North Atlantic opened above the Iceland plume.They obtained thicknesses of 33 and 30 km for traverses T-Iand T-II, close to the plume axis, and 18 and 17 km for trav-erses T-III and T-IV, closer to the margin of the head (see 3). The required to produce these crustal thick-19881988350¡C and 100¡C at the centre and margin of the head,respectively, which is consistent with the plume hypothesis. Picrites should erupt early during floodvolcanism and be most abundant near themargin The hottest material in the head is the mantle from theplume source (the dark colored fluid in F G 300넀100¡C hotter than the entrained mantle. Although 2). When aplume head melts to form a flood basalt province, only thetop of the head ascends to a level in the mantle where thepressure is low enough to allow melting. Note in F 2that Flood volcanism should be preceded by domaluplift of 500 to 1000 m at the center ofthedome The arrival of the hot plume head in the upper mantle willproduce domal uplift at the surface, the magnitude ofwhich depends on its average temperature. The area ofmaximum uplift is predicted to have a radius of ca. 200 kmand to be surrounded by a zone, with a radius of ca. 400 km,in which uplift is still significant (F Photograph of a laboratory model of a starting thermalplume ( mid-way through its ascent and ( after thehead flattens at the top of its ascent. The dark fluid represents hot materialfrom the plume source and the lighter fluid is cooler entrained material.White arrows show motion within the plume and black arrows the direc-tion of motion in the boundary layer adjacent to the plume; the bound-ary layer has been heated by conduction so that its density is approxi-mately the same as that of the plume (after Griffiths and Campbell1990).