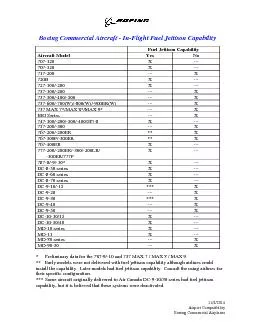
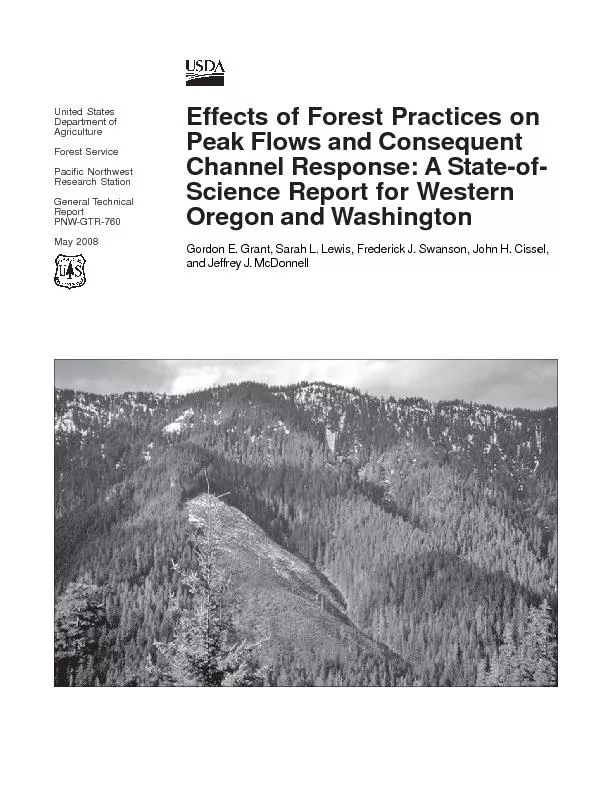
/
United StatesDepartment ofResearch StationGeneral TechnicalPNW-GTR-737 United StatesDepartment ofResearch StationGeneral TechnicalPNW-GTR-737

United StatesDepartment ofResearch StationGeneral TechnicalPNW-GTR-737 - PDF document

sherrill-nordquist
sherrill-nordquist . @sherrill-nordquist
Follow
422 views
Uploaded On 2017-01-31

United StatesDepartment ofResearch StationGeneral TechnicalPNW-GTR-737 - PPT Presentation

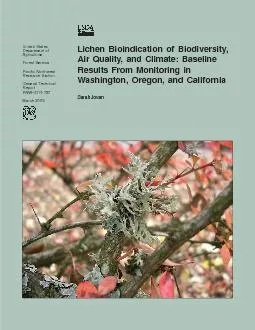
Lichen Bioindication of BiodiversityAir Quality and Climate BaselineResults From Monitoring inWashington Oregon and California Sarah Jovan Jovan Sarah 2008 Lichen bioindication of biodiversity ID: 516097

Lichen Bioindication Biodiversity Air Quality

Share:

Link:

Embed:

Download Presentation from below link

Download Pdf The PPT/PDF document "United StatesDepartment ofResearch Stati..." is the property of its rightful owner. Permission is granted to download and print the materials on this web site for personal, non-commercial use only, and to display it on your personal computer provided you do not modify the materials and that you retain all copyright notices contained in the materials. By downloading content from our website, you accept the terms of this agreement.


Presentation Transcript

United StatesDepartment ofResearch StationGeneral TechnicalPNW-GTR-737 Lichen Bioindication of Biodiversity,Air Quality, and Climate: BaselineResults From Monitoring inWashington, Oregon, and California Sarah Jovan Jovan, Sarah. 2008. Lichen bioindication of biodiversity, air quality, and climate:baseline results from monitoring in Washington, Oregon, and California. Gen.Tech. Rep. PNW-GTR-737. Portland, OR: U.S. Department of Agriculture,Forest Service, Pacific Northwest Research Station. 115 p.Lichens are highly valued ecological indicators known for their sensitivity to a widevariety of environmental stressors like air quality and climate change. This reportsummarizes baseline results from the U.S. Department of Agriculture, Forest Ser-vice, Forest Inventory and Analysis (FIA) Lichen Community Indicator coveringthe first full cycle of data collection (1998…2001, 2003) for Washington, Oregon,and California. During this period, FIA conducted 972 surveys of epiphytictrends in forest health. Major research findings are presented with emphasis onlichen biodiversity as well as bioindication of air quality and climate. Considerableeffort is devoted to mapping geographic patterns and defining lichen indicatorKeywords: Acidophytes, air quality, California, climate change, cyanolichens,forest health, gradient analysis, indicator species, neutrophytes, nitrophytes,nonmetric multidimensional scaling, ordination, Pacific Northwest, pollution. Summary of Air Quality PatternsChapter 4: Air Quality in the Greater Central Valley, CaliforniaKey FindingsIntroduction to the Model55Ancillary Data: Air Quality Measurements56Interpretation of Air Quality Estimates: Nitrogen Is Shaping LichenDiscussion of Indicator SpeciesSummary of Air Quality Patterns65Hotspots of Degraded Air QualityChapter 5: Air Quality in the Greater Sierra Nevada, CaliforniaKey FindingsIntroduction to the Model71Model Adjustment for Elevation Effects72Ancillary Data: Lichen Nitrogen Content75Interpretation of Air Quality Estimates: Nitrogen Impacts Are Apparent75Summary of Air Quality Patterns in the Greater Sierra Nevada76Major Deposition PatternsPart IV: Climate Mapping and TrackingChapter 6: Climate Biomonitoring in the West-Side PacificKey FindingsIntroduction to the Model81Ancillary Data: PRISM Model Climate Data82Interpretation of Climate EstimatesReview of Climate Zones and Indicator Species From Geiser and Neitlich83Large Stratified Cyanolichens83Hypermaritime Communities84High-Elevation CommunitiesSummary of Climate Patterns in the West-Side Pacific Northwest (spotted felt lichen) found on Mount Hood National Forest in Oregon. Part I: The FIA Lichen Community Indicator Lichen Bioindication of Biodiversity, Air Quality, and Climate: Baseline Results From Monitoring...Although appearing to be a single organism, a lichen (fig. 1) is actually a symbioticpartnership between a fungus and one or more photosynthetic organisms, an algaor cyanobacterium. Their intimate coexistence inspired the analogy (originallyconceived by Canadian lichenologist Trevor Goward) that lichens are fungi thatdiscovered agriculture (fig. 2). Typically the fungal partner provides most of thecomposite organisms structure and mass, thus trading physical protection forcarbohydrates manufactured by the photosynthetic partner (fig. 3). Together thefungus and its partner(s) can inhabit a much wider variety of habitats and condi-tions than any could on their own.The mountainous landscapes of Washington, Oregon, and California supporta very diverse and conspicuous lichen flora. This region is home to several rare,endemic, old-growth-associated species such as Pseudocyphellaria rainierensis (fig.Nephroma occultum (fig. 5) as well as species that often achieve impres-sively high biomass in western forests, like Bryoria fremontii (fig. 6many essential functional roles in these forested ecosystems. For instance, speciesBryoria and Alectoria are important forage for elk, caribou, deer, and flyingsquirrels (Maser et al. 1985, McCune 1993, Stevenson 1978). Birds, rodents, andinvertebrates also use these pendulous, hair-like species for nesting materials andshelter (Hayward and Rosentreter 1994, Pettersson et al. 1995). (tube lichen), one of several species occurring in the Pacific Western States.Sarah Jovan Lichens play manyessential functionalroles in these for-ested ecosystems. GENERAL TECHNICAL REPORT PNW-GTR-737 Lobaria pulmonaria (lung lichen), a large species found in wet forests ofthe Pacific Northwest. Lobaria pulmonaria, a three-way symbiosis between afungus, algae, and cyanobacteria. Fungal cells are located in the upper cortex (UC), medulla(M), and lower cortex (LC). Photosynthesis occurs in the green algal layer (A) and nodulescontaining cyanobacteria (CB). The cyanobacteria also fix atmospheric nitrogen into a formEric Peterson from www.crustose.net GENERAL TECHNICAL REPORT PNW-GTR-737Pseudocyphellaria anthraspisP. crocata (fig. 7), andLobaria oregana (fig. 8)make important contributions to nutrient cycling in PacificNorthwest forests as their cyanobacteria partners fix atmospheric nitrogen (Na form that is useable by plants. Nitrogen inputs from cyanolichens may be quitesubstantial, especially in moist, old-growth forests. It is estimated that L. oreganaalone fixes as much as 16.5 kg NCascades of Oregon (Antoine 2004). These lichens, like many others, are criticalextremely sensitive to environmental change, a major reason for their popularity asbioindicators for natural resource assessment (e.g., Nimis et al. 2002). The ForestInventory and Analysis (FIA) Program of the U.S. Department of Agriculture,Forest Service (USFS), includes lichens among a suite of forest health indicators(Will-Wolf 2005). Formally known as the FIA Lichen Community Indicator, theseBryoria fremontii (Freemonts horsehair lichen) in StarkeyExperimental Forest, eastern Oregon.Sarah Jovan Lichen Bioindication of Biodiversity, Air Quality, and Climate: Baseline Results From Monitoring...data are periodic surveys of epiphytic (tree-dwellingŽ) lichen communities con-ducted by specially trained field crews (fig. 9).abundance) intrinsically provides a wealth of information about forest health, func-tion, and local climatic conditions (fig. 10). Analysts can extract particular proper-gradients, to address a wide variety of monitoring questions (See sidebar 1).At present, the three primary objectives of the Lichen Community Indicator are to Pseudocyphellaria crocata Pseudocyphellaria lichen); its brightyellow soredia (powdery clusters of algal cells and fungal strands eruptingfrom the surface) are diagnostic.Tim Wheeler Lobaria oreganaimportant nitrogen-fixer inEric Straley provides a wealth Lichen Bioindication of Biodiversity, Air Quality, and Climate: Baseline Results From Monitoring...evaluate and monitor biodiversity, air quality, and climate. Survey data may bedirectly applied for biodiversity monitoring, whereas the latter two applicationsinvolve multivariate gradient models.Four gradient models that use FIA lichen data to estimate air quality and climatehave been implemented in the study region, and three to four additional modelsare scheduled for completion within the next few years (fig. 11 and table 1). Themain objective of this report is to summarize lichen biodiversity and major researchfindings from the four completed gradient models. Summaries typically includeboth original analysis and review of previously published articles. Air qualityresults are mapped to indicate forests at greatest risk of ecological degradation,and modeled climate estimates likewise signify current conditions affecting for-ests. Lichen indicator species are examined to help link air quality estimates tospecific pollutants and also to illustrate the biological underpinnings of eachgradient model. These baseline results are of great interest to forest and air manag-ers, serving as the first large-scale comprehensive assessments of forest health forthe study region.This section covers the survey protocol for the Lichen Community Indicator(USDA FS 2005) as well as analytical methods used to build gradient models forair quality and climate bioindication. These general overviews are critical to under-standing the basis for results presented in the following chapters. Less essential butmore technical explanations are presented in sidebars. Any model-specific methodsare described in their respective chapters. Sidebar 1: Why use bioindicators?of directly measuring forest conditions? Perhaps the most immediate benefitis the ability to map conditions at a sampling intensity that is prohibitivelyexpensive with active monitors. Moreover, bioindicators are intimately tied tolocal conditions. Their responses to stressors are often more representative ofcumulative impact on the function and diversity of the surrounding ecosystemthan are active monitors. results are of greatments of forest GENERAL TECHNICAL REPORT PNW-GTR-737The FIA crews have completed lichen surveys at a full cycle of plots for For-est Service Regions 5 (California) and 6 (Oregon and Washington; fig. 11). Fivepanels of plots were surveyed in 1998, 1999, 2000, 2001, and 2003, and resurveysare tentatively scheduled to begin in 2010. Extensive measurements of forest standstructure, history, and productivity are systematically collected nationwide at oneplot for every 2430 ha on the FIA phase 2 (P2) grid. Every 16 plot is also a phase3 (P3) plot where additional data are collected for all Forest Health Indicators,Lichen community surveys are conducted on a circular, 0.378-ha plot centeredon subplot 1 in the standard FIA plot design (fig. 12). Surveys last a minimumof 30 minutes and a maximum of 2 hours during which the crew member collectsa voucher specimen of every epiphytic macrolichen species encountered. Althoughdata are not a complete inventory of all macrolichen species on a plot, this cost-effective survey protocol generates representative and repeatable plot data that arecomparable across the country. Abundance is estimated for each species by usingbroad abundance codes (table 2). Surveyors collect from the surface of all stand-ing woody substrates, above 0.5 m and within arms reach, and also freshly fallenlichens in the litter. Vouchers are sent to professional lichenologists for identifica-tion in the lab. Figure 12„Forest Inventory and Analysis plot design. Lichen communi-ties are surveyed in the shaded area. cycle of plots forWashington. Lichen Bioindication of Biodiversity, Air Quality, and Climate: Baseline Results From Monitoring...Surveyors are nonspecialists specially trained to differentiate between lichenspecies. Every year surveyors must pass a certification exam administered by aprofessional lichenologist (fig. 13). At a practice FIA plot, the number of spe-lichenologist in order to certify. The lichenologist then periodically audits crewsduring the field season with hot and blind checks to ensure that species captureinstructive, where crew members and the lichenologist survey a plot simulta-neously. Blind-checked plots are usually surveyed by a lichenologist within 1month of the crew, without knowledge of the crews data, and provide a measureof data quality. Air quality estimates from FIA gradient models have been found Table 2„Abundance codes used during lichen community surveysCodeAbInfrequent (1 to 3 thalli) (4 to 10 thalli)Abundant� (10 thalli; species occurring on greater than 50 percent of boles Figure 13„The Alaskan Forest Inventory and Analysis crewprepares for the 2006 lichen certification exam.Sarah Jovan GENERAL TECHNICAL REPORT PNW-GTR-737To help build gradient models for air quality or climate bioindication, addi-tional lichen surveys may be conducted at temporary plots off the regular FIAgrid (i.e., off-frame plots). These plots are strategically located in areas of specialinterest or significance (e.g., wilderness areas and national parks) or in places ex-pected to be highly polluted (e.g., in cities, near industry) in order to capture theentire regional pollution gradient. Off-frame plots are often co-located with airData Analysis Overview: Gradient Models DemystifiedA model built with gradient analysis (see McCune and Grace 2002) is required toanalysis helps the investigator detect the strongest patterns (i.e., gradients) in lichencommunity composition and determine how they relate to environmental variables.Gradient models are typically developed by using either nonmetric multidimen-sional scaling ordination (NMS) (Kruskal 1964) or regression techniques (or somecombination of the two). Usually at least two strong gradients can be extractedAnalysts tailor these gradient models to meet the management objectives andresearch needs of their respective coverage areas. Thus no two models are exactlyalike. Attempts are made to integrate lichen data with outside sources of informa-tion, such as measurements of pollutant concentrations or deposition at off-framethe P2 and P3 grids, as well as lichen survey data from other landscape-scaleNonmetric multidimensional scaling„Nonmetric multidimensional scaling is a powerful tool for gradient analysis ofcomplex ecological data (McCune and Grace 2002) and provides the foundationconsiders the abundance of all lichen species in all plots by using a distance mea-sureŽ (e.g., Sørensen or Euclidean distance; McCune and Grace 2002). This mea-sure is a mathematical expression that quantifies how community compositiondiffers between each and every plot in the data. NMS uses these differences to strong gradientsfrom the FIA lichendata: one gradient GENERAL TECHNICAL REPORT PNW-GTR-737aspects of their local environment. In essence, NMS is a distillation of that infor-environmental gradient(s) they reflect, indicator species for that environmentalfactor can be identified.Identifying indicator species with species scores„Basically each species used to build an NMS model is scored on each of the detectedlichen community gradients. The calculation involves simple weighted averagingthat considers how the species abundance was distributed among plots and howthose plots scored on the gradient. The species score is technically its average posi- Sidebar 3: Calculating species scoresSpecies scores are calculated by using PC-ORD (McCune and Mefford 1999)in a single weighted-averaging step, whereby species abundance is weighted niijniiijjawav11 = abundance of species , and n is the number of species on the plot. A fewimportant caveats are (1) scores for infrequent species are based on less dataand so their scores are less reliable, (2) this analysis is susceptible to bias atextremes of the air quality gradient as species scores are restricted to the rangeof the data even if the species true optimum lies beyond the data extremes(McCune and Grace 2002), and (3) a score can be calculated for every specieseven if the species does not actually respond to air quality. Species scoressuggest pollution sensitivity or intolerance but should be supported by mul-tiple lines of evidence. gradients are linkedtal gradient(s) theyenvironmental Lichen Bioindication of Biodiversity, Air Quality, and Climate: Baseline Results From Monitoring...quality or climate) (McCune and Grace 2002). For a gradient linked to air quality,species scores serve as rough estimates of how species respond individually topollution in the study area, given a few caveats (see sidebar 3). Species are scoredalong the same gradient as plots. This means that any categorization of air qualityscores that the analyst uses to summarize plots (e.g., best, fair, worst) can be usedto gauge the implications of species scores and vice versa.A second tool for identification of indicator species, Indicator Species Analysis(ISA) (Dufrêne and Legendre 1997), is used in chapters 3, 6, and 7 to determineair quality and climate indicators. The ISA is a nonparametric analysis available inPC-ORD (McCune and Mefford 1999) that evaluates the faithfulness and exclusivityof each species to predefined groups of plots (McCune and Grace 2002), which areboth fundamental characteristics of a reliable indicator. The analyst chooses how tobest divide plots into a priori groups, which often involves segmentation of the airquality or climate gradient into useful categories (e.g., low, medium, and high pol-lution). To assess statistical significance of indicator species, a randomization test is GENERAL TECHNICAL REPORT PNW-GTR-737Figure 17„Lichen species richness index for plots. Lichen Bioindication of Biodiversity, Air Quality, and Climate: Baseline Results From Monitoring...The Pacific Ocean has a strong influence on climate patterns, tending to moderatetemperature fluctuation. The western border of the tri-state study region is linedby warm coastal mountains (fig.14) with lush evergreen forests to the north (i.e.,[Dougl. ex Loud.], Picea sitchensis [(Bong.) Carr.], heterophylla [(Raf.) Sarg.] , [(Mirb.) Franco] [Donn ex D. Don]), giving way to oak communities and chapparal in thedrier south. Lichen diversity across these habitats is quite variable (range: 0 to 45species) with average plot richness ranging from 10.8 to 19.2 species depending onecoregion (table 3). The most prominent diversity hotspot in California spans theSiskiyou region (M261A; fig. 17). Lichen communities of the Oregon part of theKlamath Mountains are likewise species-rich and include the highest diversity siteOregon (see sidebar 4;fig. 18).Large Agricultural Valleys (262A, 242A)Just east of the Coast Ranges in Oregon and central California lie the broad, flatWillamette Valley (Oregon half of 242A, fig. 14) and Central Valley (i.e., GreatValley 262A), where drier and hotter conditions support oak-savanna, prairies, andchaparral. These valleys are important agricultural foci and also include large citiesand industry: the Willamette and Central Valleys are home to about 70 percent and10 percent of the population in their respective states. Owing to intense develop-ment and low tree density, too few on-frame plots were surveyed to reliablycharacterize Central Valley diversity (table 3). Diversity of the Willamette Valleyand Puget Trough ecoregion (average: 15.7 species) is comparable to the adjacentCoast Ranges (M242A; 14.3 species) although species dominance is fairly differentowing to differences in climate and air quality (see chapters 3 and 6).Farther east lies a major landform that transects the study region, the volcanicCascades Range (fig. 14). This rugged network of peaks extends from the FraserRiver in British Columbia, Canada, to Lassen Peak in northern California. Thewetter west-side supports several mixed-conifer and hardwood forest types where diversity hotspot inCalifornia spans thewet forests of the GENERAL TECHNICAL REPORT PNW-GTR-737Figure 22„West-side Pacific Northwest model area. The eastern-most boundary is delineated by county lines, for the mostpart coinciding with the Cascades crest. Major cities are indicated by red asterisks. Lichen Bioindication of Biodiversity, Air Quality, and Climate: Baseline Results From Monitoring... For bioindication models that cover mountainous landscapes, it is not uncom-mon for elevation and precipitation to confound air quality estimates. Pollu-tion emissions are often concentrated at low elevations, which are also drierthan higher elevation forests (Jovan and McCune 2006, McCune et al. 1998).Among the 1,416 plots surveyed in the west-side Pacific Northwest, Geiserand Neitlich (2007) were able to select a calibration data set with equivalentnumbers of polluted and clean sites spanning the elevation and precipitationgradient. (By definition, pollutedŽ sites possessed lichens with relativelyhigh accumulations of N). This extra step reassured effective isolation of airquality versus elevation-related effects in the bioindication model. A secondstrategy for dealing with confounded environmental variables is presented in Figure 23„Riparian forest in Columbia RiverGorge Scenic Area, Oregon.Sarah Jovan GENERAL TECHNICAL REPORT PNW-GTR-737Ancillary Data: Lichen Nitrogen and Sulfur ContentTo provide independent verification of air quality patterns detected by the gradientmodel, common epiphytic lichens, like Hypogymnia (figs. 24 and 25), were collected from more than half of all surveyedare key components of several major west-side pollutants. Chemical analysis is a (ragged lichen).Roseann Barnhill, http://redskystudio.org (Imshaugs tube lichen).Tim Wheeler GENERAL TECHNICAL REPORT PNW-GTR-737Direct and Indirect Nitrogen Effects on LichensNitrogen potentially affects lichens in two ways, directly by fertilization or otherphysiological effect, and indirectly by altering bark pH. Definitive research thatclearly distinguishes between these two modes of action is lacking, in large partbecause substrate pH is often closely linked to deposition of certain N compounds.For instance, high ammonia (NHof N, like nitric acid (HNO), may have the opposite effect. This confounding ofdirect N effects by substrate pH is not necessarily problematic unless other anthro-pogenic or natural agents are present that introduce significant variation in bark pHamong sites. Alkaline dust is a common example of a natural agent that appears toaffect at least some of the N indicators in dry climates (see next section). Becauseof potential interference like this, bioindication results for N are most reliable whensupported by one or more sources of ancillary N data like those listed below.Geiser and Neitlichs (2007) ISA identified several statistically significant indica-tors of pollutedŽ plots that are widely considered nitrophytes, a well-known groupof indicator species used already by FIA for N biomonitoring in California (Jovanand McCune 2004, 2005, 2006). Nitrophyte is a term commonly used to describePacific Northwest include Candelaria concolorXanthoria(fig. 26). Many studies have documented nitrophyte enhancement as a (e.g., Frati et al. 2007; Ruoss 1999; van Dobben and de Bakker1996; van Herk 1999, 2001) although a more generalized, positive response to N Sidebar 6: Defining a priori groups for Indicator Species AnalysisAs described in chapter 1 Indicator Species Analysis,Ž ISA is used to definestatistically significant indicator species for groups of plots defined by theanalyst. In this case, Geiser and Neitlich (2007) defined two groups, pol-lutedŽ and clean.Ž Plots assigned to the pollutedŽ group had the highest air� with enhanced N (N 0.59percent). Conversely, only 10 percent of plots in the cleanŽ group, scoring atthe other extreme of the air quality gradient, had P. glauca with enhanced N. Lichen Bioindication of Biodiversity, Air Quality, and Climate: Baseline Results From Monitoring... Table 6„Species list for the west-side Pacific Northwest calibration data setgroupSpeciesAcronymFrequencyscorezonePercentNitrophytesCandelaria concolorCndcon8.190.89WPhyads25.940.69WPhyaip17.750.66WPhyscia americanaPhyame3.410.82WPhyten8.530.82WPhysconia enteroxanthaPhoent4.441.07WPhysconia perisidiosa7.510.97WXanfal3.751.09WXanthoria candelaria3.410.83WXanthoria parietina1.711.15WXanthoria polycarpaXanpol25.600.71Wacidophytes Bryoria capillaris-0.27BestBryoria fremontii-0.25BestBryoria friabilis-0.30BestBryoria fuscescens-0.46BestBryoria glabraBrygla9.22-0.36BestBryoria pseudofuscescens-0.25BestBryoria subcana-0.41BestBryoria trichodes-0.46BestCetraria canadensisCetcan7.85-0.02GoodCetraria chlorophyllaCetchl51.88-0.01FairCetraria merrillii3.410.27DeCetraria orbata-0.01FairCetraria pallidulaCetpal7.85-0.35BestCetraria platyphyllaCetpla16.04-0.18BestCladonia chlorophaeaClachl2.050.00FairCladonia fimbriataClafim8.870.45Cladonia ochrochloraClaoch20.48-0.11BestClasqu18.09-0.18BestCladonia transcendens14.680.07FairClaver2.050.17FairEvernia prunastri Evepru52.900.46Hypogymnia apinnataHypapi37.88-0.33BestHypogymnia enteromorphaHypent61.77-0.26BestHypogymnia heterophyllaHyphet2.05-0.48BestHypogymnia imshaugii-0.09Good Lichen Bioindication of Biodiversity, Air Quality, and Climate: Baseline Results From Monitoring... Table 6„Species list for the west-side Pacific Northwest calibration data set (continued)groupSpeciesAcronymFrequencyscorezonePercentStratifiedcyanolichensLobaria halliiLobhal2.050.17FairLobaria oregana-0.48BestLobaria pulmonariaLobpul33.110.00FairLobaria scrobiculata12.290.36Nephroma bellum-0.42BestNephroma helveticum11.950.03FairNephroma laevigatum-0.25BestNephroma occultum-0.44BestNephroma parile-0.18BestNephroma resupinatum10.240.25DePeltigera britannica-0.07GoodPeltigera collina28.330.31DePeltigera membranacea-0.05GoodPeltigera neopolydactylaPelneo2.39-0.47BestPseudocyphellaria anomalaPcyano20.140.05FairPseudocyphellaria anthraspisPcyant19.11-0.24BestPseudocyphellaria crocataPcycro-0.33Best14.330.32De15.360.09FairUnknownAlectoria imshaugii-0.11BestAlectoria sarmentosa-0.36BestAlectoria vancouverensisAlevan4.78-0.24BestCavernularia hulteniiCavhul8.53-0.46BestCavernularia lophyreaCavlop13.31-0.40BestCetrelia cetrarioidesCelcet7.170.28DeCollema furfuraceum1.710.90WCollema nigrescensColnig1.371.08WEsslingeriana idahoensis-0.09GoodFuscopannaria leucostictoidesPanleu1.71-0.36BestFuscopannaria saubinetiiPansau-0.17BestHypocenomyce castaneocinerea-0.11BestHypocenomyce scalaris2.730.50WHypotrachyna sinuosa-0.10GoodLeptogium corniculatum1.370.04FairLeptogium lichenoidesLeplic1.710.47Leptogium polycarpumLeppol5.460.23DeLeptogium saturninum2.390.92WLetharia vulpinaLetvul14.330.07FairMenegazzia terebrata-0.19Best Lichen Bioindication of Biodiversity, Air Quality, and Climate: Baseline Results From Monitoring... Table 7„Species scores summarized by nitrogen (N) indicator group and Geiser and Neitlichs (2007)groupMeanMinMaxnBestGoodFairDegradedPoorWorst … … … … … … … … … … … … Percent… … … … … … … … … … … …Nitrophytes0.880.661.15110.00.00.00.00.0100.0-0.13-0.540.464959.214.314.36.16.10.0Neutrophytes0.721717.65.917.611.811.835.3-0.07-0.480.361942.110.526.315.85.30.0Unknown0.091.082944.86.910.313.810.313.8 Figure 31„Distribution of species scores according to N indicator group. Box plots aredivided into quartiles with outliers indicated by lines. Ranges of the BestŽ and WorstŽ airquality zones (depicted on the x-axis in figure 30) are indicated on the y-axis. GENERAL TECHNICAL REPORT PNW-GTR-737NMS model is ultimately unknown, although NH and its reaction product, NHseem likely to be major components. Besides correlation of the air quality gradient(see Interpretation of Air Quality EstimatesŽ), the distribution of-dependent optimum curves published by Sparrius (2007).Summary of Air Quality PatternsThe gradient model was used to estimate air quality at a full cycle of FIA data (n =243; 1998-2001, 2003) to describe baseline conditions affecting west-side PacificNorthwest forests. About 75 percent of these plots were included in the extensiveair quality summary published by Geiser and Neitlich (2007). Air quality zonesused to categorize plot scores are the same as those used in the previous sectionfor discussing species scores (see sidebar 7). The spread of plot scores among airquality zones (table 8) was similar for Oregon and Washington, as was averagescore (-0.05 and -0.07, respectively).Consistent with Geiser and Neitlichs (2007) observations, nitrophyte-richsites receiving high (poor) air quality scores were prevalent near urban and agricul-tural areas (fig. 32). It follows that valley and low-elevation foothill forests of theWillamette Valley and Puget Trough ecoregion (covering about 38 600 kmproportionally the most affected by poor air quality (fig. 32). Air quality scores forthis ecoregion were varied (SD = 0.49), spanning nearly the full range of the data(-1.08 to 1.59; table 9), but the majority of sites scored as DegradedŽ or worse.This region included 8 of the 12 plots receiving the worst 5 percent of air qualityscores (fig. 33).Concentration of human activity and its infrastructure generate high pollutionemissions in this ecoregion compared to elsewhere in the study area. A large pro-portion of the human population in Washington and Ore�gon ( 65 percent) inhabitsthe cities of the Willamette Valley and Puget Trough (Oregon Department of Fishand Wildlife 2006, Washington Department of Fish and Wildlife 2005). Urbandensity is greatest along the oftentimes congested Interstate-5 corridor (fig. 22),which serves as the main conduit of north-south motor vehicle travel. The eco-region possesses abundant productive farmland that supports a diversified agricul-tural-based economy, as well as forestry, manufacturing, and tourism (OregonDepartment of Fish and Wildlife 2006, Washington Department of Fish and Wild-life 2005). Correspondingly, agricultural, industrial, and motor vehicle pollutant N Valley and low-forests of theWillamette Valleyand Puget Troughpoor air quality. GENERAL TECHNICAL REPORT PNW-GTR-737 Figure 32„Air quality scores for the west-side Pacific Northwest divided into Geiser and Neitlichs air quality zones(2007). Scores are unitless until calibrated with pollutant measurements. See figure 22 for ecoregion codes. Lichen Bioindication of Biodiversity, Air Quality, and Climate: Baseline Results From Monitoring... Figure 33„Extreme best and worst 5 percent of air quality scores. All other plots are indicated in gray. See fig. 22 forecoregion codes. GENERAL TECHNICAL REPORT PNW-GTR-737The model suggested that plots on the Willamette Valley fringe in the foothillsof the Cascades and Coast Ranges tend to experience worse air quality than moreremote forests (fig. 32). Regardless, most air quality scores in both the Cascadesand Coast Ranges fall in the bestŽ category. Some air quality degradation wasdetected in the Klamath ecoregion, primarily in association with cities on or nearInterstate-5. Air quality at a few coastal plots is classified as poorŽ or worst,Žalthough such sites were widely distributed with no discernable clustering.Most plots receiving the lowest (best) 5 percent of scores were near nationalparks and on the immediate coast in Washington (fig. 33). Overall, lichen commu-nities suggested relatively good air quality for forests in the northern Olympicpeninsula and mid to high Cascades. Ostensibly, these forests benefit from theirThe importance of N as an ecological stressor in some west-side Pacific Northwestforests is unmistakable given the clear association of N/pH lichen indicator groupsmost impacted by poor air quality, as suggested by the spatial distribution of airscores and verified by enhanced accumulations of N and S in collected lichens(Geiser and Neitlich 2007). Estimated pollution hotspots are somewhat localizedregional issue (Fenn et al. 2003a, 2003b). If emissions intensify, the geographicscope of pollution impacts may, of course, extend in tandem.Excessive N is a growing problem in many developed nations as documented inFenn et al. 1998, Holland et al. 2005, Vitouseket al. 1997). But in the bigger picture, how dire is the status of forest air quality inthe west-side Pacific Northwest? A direct comparison to other regions is precludedby the lack of comprehensive instrumented pollutant measurements, which meansthat we hardly know how much N is actually getting into the system. As reviewedby Fenn et al. (2003a), N deposition patterns are unknown for most of the WesternComparison is likewise difficult because large-scale characterizations of dry Ndeposition, potentially a major component of total N loading, are highly uncertain(Holland et al. 2005). Given these caveats, the best available information doessuggest that N deposition to the Pacific Northwest is milder than that for much of The importance ofNorthwest forestsis unmistakable. GENERAL TECHNICAL REPORT PNW-GTR-737 GENERAL TECHNICAL REPORT PNW-GTR-737Figure 34„Greater Central Valley model area. Off-frame plots are indicated by red asterisks and named after the cityor park in which they were located. Off-frame plots not named on the map are numbered as follows: 1 = Red Bluff,2 = Chico, 3 = Colusa, 4 = North Highland, 5 = Placerville, 6 = San Andreas, 7 = Stockton, 8 = Pittsburg, 9 =Merced, 10 = Visalia, 11 = Los Padres National Forest, 12 = Santa Ynez, 13 = Lompoc, 14 = Nipomo, 15 =Atascadero, 16 = King City, 17 = Pinnacles National Monument, 18 = Gilroy, 19 = Davenport, 20 = San Jose, 21 =Fremont, 22 = Crockett, 23 = Vallejo, 24 = Santa Rosa. The plot surveyed in Bakersfield was excluded from all Lichen Bioindication of Biodiversity, Air Quality, and Climate: Baseline Results From Monitoring...Figure 35„Aerial view of Central Valley landscape, taken somewhere between Patterson andMerced. Griffin McKinney (pilot). Dr. Christopher Bochna Table 10„Pollution data for the greater Central Valley used to interpret the air quality gradient VariablenMeasurement typeData source14Annual arithmetic meanCARB; Data averaged over 1999 to 200222Annual arithmetic meanCARB; Data averaged over 1999 to 200230Maximum 1-hour valueCARB; Data averaged over 1999 to 2002estimate; SUM60 indexUnpublished data provided by T. Pritchard.All sitesEstimate of emissions;California Gridded Ammonia Inventorytons per yearModeling System; ENVIRONIndex calculated with land use data from theCalifornia Gap Analysis Project; Davis et al. 1998 All California Air Resources Board (CARB) data are publicly accessible at: http://www.arb.ca.gov/aqd/aqdpage.htm. = sulfur dioxide, NO = nitrogen dioxide, O = ozone, and NH = ammonia. SUM60: the sum of all hourly O concentrations 60 parts per billion from June 1 to August 31, 2002. Ancillary Data: Air Quality MeasurementsEach off-frame plot was co-located with an air quality monitor operated by theCalifornia Air Resources Board that measures at least one major anthropogenic Lichen Bioindication of Biodiversity, Air Quality, and Climate: Baseline Results From Monitoring... Table 11„Species list for the greater Central Valley calibration data setgroupSpeciesAcronymFrequencyscorecategoryNitrophytesPercentCandelaria concolorCndcon87.76-0.012Flavoparmelia caperata-0.022Flavopunctelia flaventior51.020.133-0.441 (Worst)Phaeophyscia orbicularis-0.302Phyads67.350.002Phyaip32.650.193Phydim15.31-0.112Phydub4.08-0.102Physcia stellarisPhyste20.410.173Phyten36.73-0.132Physconia enteroxanthaPhoent27.550.012Physconia perisidiosa56.120.113Punctelia perreticulata24.490.213Xanfal-0.252-0.13236.730.012Xanthomendoza oregana-0.272Xanthoria candelaria9.180.293Xanthoria parietina-0.262Xanthoria polycarpaXanpol50.000.002Xanthoria tenax-0.511 (Worst)Potential acidophytes Cetraria merrillii11.220.574 (Best)Cetraria orbataCetorb6.120.373Evernia prunastriEvepru56.120.263Hypogymnia imshaugii20.410.544 (Best)Hypogymnia tubulosaHyptub4.080.404 (Best)Platismatia glauca4.080.644 (Best)Usnea arizonica4.080.273-0.152Usnea glabrata-0.0526.120.143Usnea substerilis-0.092Potential neutrophytes Melanelia elegantulaMelele5.100.053Melanelia exasperatulaMelexl4.080.103Melful6.120.313Melanelia glabraMelgla61.220.263Melanelia subargentifera-0.092Melanelia subolivaceaMelsol31.630.143Parmelia hygrophilaParhyg4.080.404 (Best)Parmelia sulcataParsul16.330.424 (Best)Ramalina farinaceaRamfar25.510.073-0.331 (Worst) Lichen Bioindication of Biodiversity, Air Quality, and Climate: Baseline Results From Monitoring...Figure 38„Display of species scores along the air quality gradient (x-axis), which is divided into four air quality categoriesbased on data quartiles. The y-axis is included here for display purposes only; it is a second gradient in lichen communitycomposition incidental to the discussion. Full species names are given in table 11. GENERAL TECHNICAL REPORT PNW-GTR-737 Table 12„Species scores summarized by nitrogen (N) indicator group and air qualitygroupMeanMinMaxn1 (worst)234 (best) … … … … … … … Percent … … … … … … …Nitrophytes-0.06-0.510.29229.163.627.30.00.26-0.150.64110.027.345.527.30.07-0.330.42137.730.853.87.7Cyanolichens0.620.610.6220.00.00.0100.0Unknown0.11-0.290.45160.041.243.811.8 Figure 39„Distribution of species scores according to nitrogen (N) indicatorgroup. Box plots are divided into quartiles with outliers indicated by lines.Ranges of the bestŽ and worstŽ air quality zones (depicted on the x-axis infig. 38) are indicated on the y-axis.comparison. It is likely that N deposition has already marginalized some sensitivespecies from these groups although low diversity may partly be a natural conse-quence of the hot, dry valley climate, as discussed further in chapter 4. Among thecyanolichens and potential acidophytes found in the study area, however, most didscore within the better two air quality categories suggesting an association with lowto moderate N and substrate pH (table 12, fig. 39). species were an excep-tion, scoring low compared to other acidophytic candidates (table 11). Because the these groups. Lichen Bioindication of Biodiversity, Air Quality, and Climate: Baseline Results From Monitoring...genus is so large and ecologically diverse, some species may well have neutrophyticSummary of Air Quality PatternsThe following summary is based on air quality scores for most plots in the greaterCentral Valley calibration data set (Jovan and McCune 2005; n = 94) plus anadditional 14 sites surveyed for lichens in 2003. Air quality scores are categorizedinto zones based on quartiles from the on-frame data only; off-frame plots areexcluded as they will not be resampled. About a quarter of on-frame sites are thusin the worstŽ zone. This particular representation of on-frame data will becomemore informative when used for assessment of air quality trends. Air quality zonescan be redefined with more biologically meaningful thresholds once N criticaldeposition of one or more forms of N that, if exceeded, has a harmful effect onDifferences in the distribution of air quality scores estimated for on-frameversus off-frame plots are dramatic (table 13). Scores from off-frame plots had avery poor average (-0.27), and 26 of these plots (81 percent) scored in the worst airquality zone. Scores differed widely within ecoregions, with the highest N impactstypically estimated for off-frame sites near urban and agricultural areas (fig. 40).The variable spatial pattern of scores may be a reflection of high NH levels. Incontrast to most other major N pollutants, like nitrogen oxides (NO)-containing aerosols (see sidebar 9), a high propor-tion of gaseous NH is dry deposited near the emission source. This makes a Table 13„Air quality scores from the greater Central Valley (GCV) modelParameterGCVOn-frameOff-frameNumber of plots surveyed10876321: (Worst) -0.99 to 0.13451926 2: 0.13 to 0.5523194 3: 0.55 to 0.8522202 4: (Best) 0.85 to 1.5818180Air quality score extremes-0.99 to 1.58-0.86 to 1.58-0.99 to 0.70Average air quality score0.280.52-0.27Standard deviation of air quality scores0.610.500.46 Plots were excluded from analysis if they lacked species, had no species in common with thecalibration plots, or were duplicate surveys used for quality assurance purposes. GENERAL TECHNICAL REPORT PNW-GTR-737 Figure 41„Extreme best and worst 10 percent of air quality scores. Off-frame plots are symbolized by asterisks. Seefigure 34 for ecoregion codes. Lichen Bioindication of Biodiversity, Air Quality, and Climate: Baseline Results From Monitoring...a finer spatial scale, and moreover, lichens may not respond equally to all forms ofN (see chapter 3 Direct and Indirect Nitrogen Effects on LichensŽ section).Regardless, both hotspots were detected with the lichen gradient model (fig. 40).Several FIA sites scoring among the worst 10 percent were from the San Joaquinand Bay area (fig. 41). Lichen abundance in communities from the worst 10percent was, on average, 72 percent nitrophytic (including two plots that are 100percent nitrophytic).Valley and downwind in forests of the southern Sierra Nevada foothills (fig. 40).Many of the best-scoring sites (fig. 41) occurred in the northern and central Sierrahuman habitation and industry (average abundance in nitrophytes at the best 10percent of sites was 31 percent). Similar patterns were detected in the statewide Nanalysis by Weiss (2006). Nitrogen deposition estimatesFor perspective, the community multiscale air quality model estimates maxi-mum nitrogen (N) in the Los Angeles Basin at 21 kg (Weiss 2006), althoughdeposition levels in excess of 45 kg have been measured in that region (Fennet al. 2003b). The Los Angeles Basin is believed to receive the highest Ndeposition in the Nation (Fenn et al. 2003b). Conversely, background Ndeposition in the Western United States is commonly estimated at 0.5 kg(Baron 2006, Holland et al. 1999).Nitrogen, probably mostly in the form of NHimportant driver of lichen community composition in the greater Central Valley. estimates (Jovanand McCune 2005), and geographic distribution also broadly matched the regionalN analysis by Weiss (2006). Moreover, complementary ecological evidence lies inthe distribution of N indicator species along the air quality gradient detected by Many of the best- Lichen Bioindication of Biodiversity, Air Quality, and Climate: Baseline Results From Monitoring...Chapter 5: Air Quality in the Greater Sierra1.The lichen bioindication model suggested that nitrogen (N) compounds areimpacting some forests of the greater Sierra Nevada.2.Plots with high estimated N impact were (by definition) more dominated byindicator species of N-enriched environments and high bark pH than low-impact3.Lichens collected from high-impact sites likewise tended to have relatively highN content (Jovan and Carlberg 2007).4.Lichen community composition and N content of lichens both suggest thatforests of the southern Sierra Nevada lie in a large N hotspot, as further evi-5.Areas of relatively low N influence were substantial in the northern half of theThe greater Sierra Nevada is a mountainous region in California spanning mostof the Sierra Nevada Range, the Southern Cascades, the Modoc Plateau, and high-elev�ation sites (1500 m) in the eastern Klamath Mountains (fig. 42). The majorityof the western boundary lies along the highly agricultural Central Valley (chapter4), which is widely recognized as an important source of pollutants carried intoSierran forests (Bytnerowicz and Fenn 1996; Bytnerowicz et al. 2002; Cahillet al. 1996; Fenn et al. 2003b, 2003c). By comparison, the greater SierraNevada is considerably less populated and less developed for agriculture and(figs. 43 and 44).Overall, long-term air quality data are limited although various short-termmonitoring campaigns help characterize conditions in the Sierra Nevada Range(reviewed by Fenn et al. 2003c). It is well established that nitrogen (N) pollutantscan reach high levels in some Sierran forests, most especially at sites in the south-) (Fenn et al. 2003c, Weiss 2006). Depositionis apparently high enough in some cases to provoke classic ecological symptoms of GENERAL TECHNICAL REPORT PNW-GTR-737Sequoia, and Lassen Volcanic National Parks (figs. 43 and 44). Extra steps wereneeded to ensure that the greater Sierra Nevada model isolates air quality effectsfrom the strong influence elevation naturally exerts on lichen communities (Jovanand McCune 2006). The problem arises because air quality and elevation are atleast somewhat correlated with each other in the study area (Fenn et al. 2003c).Higher elevation sites tend to be less N polluted than the foothills (fig. 42) sincethere are fewer local emission sources and forests are farther from the CentralValley with its high density of N sources (Jovan and McCune 2006).The greater Sierra Nevada model is built around a simple index of indicatorspecies used for N bioindication in the greater Central Valley, the proportion ofnitrophyte abundance (PNA; see chapter 4 Interpretation of Air Quality Estimates:Nitrogen is Shaping Lichen Community StructureŽ section). The PNA is the sum-med abundance codes for all nitrophytes (table 14) divided by the summed abun-dance of all lichen species found in the survey. Nitrophytes are most frequently), but it is unclear to what degree species are responding tothe N versus the increase in bark pH that NH causes (see chapter 3 sections Directand Indirect Nitrogen Effects on LichensŽ and NitrophytesŽ). To isolate the lichenresponse to air quality, elevation was regressed on the PNA using nonlinear regres-sion with a generalized sigmoid curve (Jovan and McCune 2006; see sidebar 11).The unstandardized residuals from the nonlinear regression serve as the air qualityscores for the greater Sierra Nevada.Ancillary Data: Lichen Nitrogen ContentTo complement air quality scores, Letharia vulpina (fig. 45) was collected fromscores (Jovan and Carlberg 2007). Kjeldahl analysis was used to determine howanalysis of lichen collections is a widely practiced bioindication tool sometimesemployed to estimate N levels in air and precipitation (Bruteig 1993, Geiser andfollowed the protocols used by Geiser and Neitlich (2007) as documented in Blett GENERAL TECHNICAL REPORT PNW-GTR-737 Table 14„Species list for the greater Sierra Nevada (continued)Nitrogen indicator groupSpeciesAcronymFrequencyPercent Pseudocyphellaria anomalaPcyano2.55Pseudocyphellaria anthraspisPcyant3.18UnknownAhtiana sphaerosporellaAlectoria sarmentosaEsslingeriana idahoensisLeptogium lichenoidesLeplic6.37Letharia columbianaLetcol59.87Letharia vulpinaLetvul75.16NodobryoriaNod6.37Nodobryoria abbreviataNodabb43.31Nodobryoria oreganaParmelina quercinaPnaque9.55Phybiz5.73Physconia americanaPhysconia isidiigera Tentative designations of acidophytes and neutrophytes are based on whether the species belongs to a genus exhibitingacidophytic or neutrophytic behavior in the Netherlands (van Herk 1999, 2001; Sparrius 2007) or United Kingdom Species assigned to different indicator groups in the literature. is not widely defined asEvernia prunastri is considered a neutrophyte by Gombert et al. 2005. Jovan and McCune (2005, 2006)classified Parmelia hygrophila and as nitrophytes. Air quality scores for plots in the greater Sierra Nevada are derived as follows:€Calculate the proportion of nitrophyte abundance (PNA) in the lichen€Plug elevation (in meters) into the nonlinear regression equation to 5)1689(148.0.ElevationY €Subtract from the actual PNA and multiply by 100. ).(100scorequality Air YPNA €The resulting air quality score is a measure of how much the PNA isabove or belowwhat is expected given the plot elevation. A higher Lichen Bioindication of Biodiversity, Air Quality, and Climate: Baseline Results From Monitoring...Figure 46„Extreme best and worst 10 percent of air quality scores. Off-frame plots are symbolized by asterisks. Seefigure 42 for ecoregion codes. GENERAL TECHNICAL REPORT PNW-GTR-737Figure 47„Air quality scores for the greater Sierra Nevada model area divided into air quality zones. Scores are unitlessuntil calibrated with pollutant measurements. Scores for on-frame (circles) and off-frame plots (asterisks) are indicated by acommon color scheme. See figure 42 for ecoregion codes. Lichen Bioindication of Biodiversity, Air Quality, and Climate: Baseline Results From Monitoring...) from the CMAQ model estimatecially at lower elevations and more southerly sites.A smaller deposition hotspot may occur on the eastern Modoc Plateau asindicated by poor air quality scores (figs. 46 and 47) and high N accumulation (upLetharia vulpina collections (Jovan and Carlberg 2007,Jovan and McCune 2006). There are not, however, any local N measurements tocorroborate lichenological evidence of N impact. There are indeed agricultural Nsources in the Modoc although the area is fairly remote and sparsely populated.Closer investigation would be needed before drawing any firm conclusions. Alka-line dust may contribute to the high abundance of nitrophytes in the dry landscapeof the plateau (see chapter 3 Direct and Indirect Nitrogen Effects on LichensŽRelatively low N influence was otherwise estimated for many forests in thenorthern half of the study area, which includes all plots scoring in the best 10 per-cent (figs. 46 and 47). Lichen communities from the southern Cascades and north-ern Sierra Nevada were frequently rich in acidophytes, neutrophytes, as well as avariety of species of unknownŽ N indicator value (table 14; see chapter 3 Discus-sion of Indicator SpeciesŽ section). Some of these forests likely receive N from theSacramento Valley, although there are few in situ N measurements to help quantifyexposure.Nevada, as evidenced by (1) the distribution of nitrophytes in the FIA Lichen Com-Letharia vulpina collections, (3) Nestimates from the CMAQ model, and (4) various short-term N monitoring cam-paigns (Fenn et al. 2003b, 2003c). Altogether these varied data sources make aclear case for high N impact to forests in the southwestern Sierra Nevada, a scenicregion lavish with over 1.2 million ha of land in 17 federally protected class Iareas. Ozone is also a major stressor in these forests as evidenced by the FIA OzoneIndicator, where 82 percent of ozone biosites in the San Joaquin Valley air basin(all located in the southern Sierra Nevada) and 27 percent of biosites in the Moun-tain Counties air basin (central and northern Sierra Nevada) exhibited foliardamage between 2000 and 2005 (Campbell et al. 2007). Tonnesen. 2007. Unpublished data. On file with: R. Johnson, Center for ConservationBiology, 2415A Boyce Hall, University of California Riverside, Riverside, CA 92521. ests in the northern GENERAL TECHNICAL REPORT PNW-GTR-737Independent Slopes Model (PRISM) (Daly and Taylor 2000). Variables were alllong-term annual averages (1969 to 1990) at 2 km resolution, and included dewpoint, maximum August temperature, minimum December temperature,continentality (e.g., the difference between the latter two variables), number of wetdays, precipitation, and relative humidity. Mean annual days of marine fog andannual temperature were obtained from Lipow et al. (2004).Interpretation of Climate Estimateswas strongly patterned on a temperature gradient (Geiser and Neitlich 2007).Climate scores were most correlated with minimum December temperature and = - 0.79 and 0.73, respectively). In other words, high scoresindicate forest habitats that endure lower minimum temperatures and a widertemperature range throughout the year. Despite this relation, these scores are notnecessarily a pure reflection of temperature and are more appropriately regardedas an integrative lichen response to local climate. Predictably, other variables hadsubstantial linear correlations to climate scores like relative humidity (and geographic covariates such as elevation ( = 0.68), longitude ( = 0.68), anddistance from the ocean ( = 0.67).Review of Climate Zones and Indicator SpeciesGeiser and Neitlich (2007) used natural breaks (Jenks 1967) to divide climatescores from all 1,416 plots into four broad zones: maritime (lowest scores), low-land, montane, and high elevation (highest scores). A comparison of current meanobservation that even under the most conservative scenario [+1.5 °C for thePacific Northwest, according to Mote et al. 2003] mean maritime temperatureswould shift above any current climate zone range [in the study area]. The lowlandmean would be shifted into the maritime range under the minimum change scenarioand above any current zone under the maximum change [+3.2 °C; Mote et al.2003] scenarioŽ (Geiser and Neitlich 2007). That lichen community compositioncould be used to classify forests into distinctive climate zones is itself a compellingindication that some species will be highly responsive to climate change. Accord-ingly, Indicator Species Analysis (ISA) (Dufrêne and Legendre 1997) (for methods classify forests intozones is itself a GENERAL TECHNICAL REPORT PNW-GTR-737Summary of Climate Patterns in the West-Sideclimate and will be utilized by the FIA Program and the Forest Service Region 6Air Resource Program to track effects of climate change on forest communities.Plots constitute a full cycle of FIA lichen data (n = 249; 1998 to 2003). About 75percent of plots were included in Geiser and Neitlichs (2007) extensive summary.Climate scores for west-side Oregon and Washington are summarized in table16 using Geiser and Neitlichs (2007) climate zones. The spatial pattern of climatescores is analogous to the more extensive map of Geiser and Neitlich (2007), withgeographically cohesive climate zones that coincide with sizeable portions ofecoregions (fig. 51). As expected, low scores characteristic of the maritime andlowland zones were predominantly assigned to low-elevation forests of the Oregonand Washington Coast Ranges and the Willamette and Puget Trough ecoregions (seefig. 14). Farther from the temperature-moderating effects of the ocean, the higherscoring, cooler forests of the montane and high-elevation climate zones predomi- Table 16„Core table summarizing climate scores for the west-side Pacific Northwest (PNW)model area by state (1998-2001, 2003)West-sideWest-side West-sideParameterPNW OregonWNumber of plots surveyed243140103Maritime/warmest (-1.41 to -0.25)733241Lowland (-0.25 to 0.23)542925Montane (0.23 to 0.66)573819High elevation/coolest (0.66 to 1.73)594118Climate score extremes-1.41 to 1.73-1.21 to 1.73-1.41 to 1.15Average climate score0.140.27Standard deviation on climate scores0.640.630.61 Categories are based on climate zones defined by Geiser and Neitlich (2007). Plots were excluded fromanalysis if they lacked species, had no species in common with the calibration plots, or were duplicate surveys Lichen Bioindication of Biodiversity, Air Quality, and Climate: Baseline Results From Monitoring...1.Lichen community composition in northern and central California is closelypatterned on two macroclimatic gradients: the first gradient appears strongly2.Following the analytical procedure of Geiser and Neitlich (2007) (chapter 5),plot scores along the first gradient were divided into four temperature zonesdiffering in mean temperature and elevation. Scores on the second gradientwere divided into four moisture zones differing in mean number of wet days3.An Indicator Species Analysis (ISA) (Dufrêne and Legendre 1997) foundmultiple statistically significant lichen indicator species for each climate zone.Results provide a general framework suggesting how long-term temperature4.With the advent of rising temperatures, species restricted to cooler forests atmid to high elevations may face a regionally shrinking niche, whereas commu-nities of warmer temperature zones may presumably migrate upwards inelevation.5.Predictions of precipitation changes conflict among global climate modelswettest and the driest zones are most likely to endure range contractions in thestudy region depending on which way (if any) precipitation patterns swing.The U.S. Department of Agriculture Forest Inventory and Analysis (FIA) Programtral California forests (fig. 52) (Jovan and McCune 2004). Lichen communities inthis region are strongly influenced by coast-to-inland macroclimatic gradients thatare intensified by the diversity of landforms in the mountainous terrain. The FIAclimate model was originally developed by Jovan and McCune (2004) as a tool todelineate three smaller, more climatically homogeneous model areas for air qualitybioindication (fig. 52): the southernmost boundary of the climate study region GENERAL TECHNICAL REPORT PNW-GTR-737temperature and moisture gradients detected by NMS were each divided into four1967). Lichen indicator species were defined for each climate zone with ISA (formethods see chapter 1 Indicator Species AnalysisŽ section); in this case the stron-everywhere else. It is important to note that rare species cannot be significantindicators because it is probable that all of the species occurrences will fall withinAverage temperature or moisture per zone was calculated from the PRISMintersecting modeled climate data (from lichens) to modeled climate data (fromPRISM), there is unavoidably some noise in their relationships to one another.Still, results provide a generalized, descriptive framework for forecasting commu-nity-based responses to climate change.Proposed Temperature EffectsIndicator species, mean temperature, and mean elevation per climate zone fromthe first gradient detected by NMS are displayed in table 17. Despite overlappingranges, mean temperatures decrease by 1.2, 3.1, and 2.0 °C between consecutivezones. Predicted warming trends could potentially have a powerful impact onlichen assemblages given that average temperatures in California are expected toincrease by 1.7 to 5.8 °C by 2100 (California Climate Change Center 2006a,2006b). This wide temperature range was derived from multiple climate scenariosdiffering by anticipated magnitude of greenhouse gas emissions and assumedclimatic sensitivity (California Climate Change Center 2006a, 2006b) (see sidebar13). Depending on how quickly warming proceeds, shorter-term impacts to lichensMigrations of temperature-sensitive lichen species are expected to proceedfrom lower to higher numbered climate zones as defined with the FIA LichenCommunity Indicator data (table 17); how this trend might play out geographicallyis demonstrated in section 7.4 below. The warmer zones, 1 through 3, are eachcharacterized by numerous indicator species spanning a variety of lichen generaand functional groups. The comparatively low diversity of zone 4 indicators is notsurprising considering the harsh climatic conditions of high-elevation forests.Ahtiana sphaerosporella (fig. 53) and Parmeliopsis ambigua (fig. 54; table 17) areboth hardy boreal species. Like high-elevation species in the west-side PacificNorthwest (see chapter 6 High-Elevation CommunitiesŽ section), these indicators ful impact on lichen GENERAL TECHNICAL REPORT PNW-GTR-737 Feedback loopsWarming predictions were compiled from three global climate models thatdiffer in climate sensitivity (i.e., how sensitive temperature will be to green-house gas concentrations). An important determinant of climate sensitivity isthe influence of environmental feedback loops wherein warming stimulates abiological or physical process that has positive feedback on temperature. Oneincreasingly famous example with potentially global consequences is warmingof the extensive Siberian permafrost. Thawing causes the release of green-house gases (methane and carbon dioxide) from the decomposing peat, whichaccelerates atmospheric warming, which then accelerates thawing, and so on.cores, Torn and Harte (2006) argued that feedback loops will have consider-Figure 53„Ahtiana sphaerosporella lichen).Jim Riley, OSU lichen group Lichen Bioindication of Biodiversity, Air Quality, and Climate: Baseline Results From Monitoring... Parmeliopsis occurring in the Western UnitedP. hyperopta (on left, bran lichen) and P. ambigua (on right, ambigu-and their respective communities face a shrinking niche that may force theirdistributions polewards. Zones 1 through 3 may shift to higher elevations, although2006b) suggest it is plausible that zone 3 communities may also face a locallyNitrophytic indicator species identified by the ISA were asymmetricallydistributed among climate zones, being primarily associated with the warm, low-elevation forests of zone 1 (table 17). Nitrophytes are most commonly used asare known for their high tolerance to heat and light exposure. It has been proposedelsewhere (van Herk et al. 2002) that nitrophytes will benefit from warming trendswith increased abundance in temperate regions. The apparent association of sometively seems to support this notion. More investigation is needed, however, to ruleout confounding by the high N deposition in the greater Central Valley (see chapter Nitrophytes willbenefit from warm-increased abun-dance in temperateregions. GENERAL TECHNICAL REPORT PNW-GTR-737Proposed Moisture Effectsoverlapped for both moisture variables, although means steadily declined betweenzones. Wet days decreased by 10, 19, and 8 days between consecutive zones whileprecipitation decreased by 27, 39, and 8 cm, respectively. Three of the four mois-ture zones had 11 or more indicator species. Unlike temperature, there is no clearoutlook for precipitation trends in California. According to the three main climatecipitation patterns may remain stable, increase, or decrease. Even if precipitationitself does not change, however, temperature changes will affect relative humidityand thus increase the amount of moisture available to lichens. Table 18„Indicator species of moisture zones in northern and central CaliforniaAlectoria sarmentosa, Alectoria vancouverensis, Bryoria capillaris, BryoriaWet foreststrichodes, Cladonia fimbriata, Cladonia furcata, Cladonia ochrochlora,Cladonia subsquamosa, Cladonia transcendens, Cladonia verruculosa,Wet days: 99 (21)Esslingeriana idahoensis, Hypogymnia enteromorpha, Hypogymniainactiva, Hypogymnia occidentalis, Hypogymnia physodes, Lobar ia, Parmeliopsis hyperopta, Parmotrema arnoldii, Platismatiaglauca, Platismatia herrei, Platismatia stenophylla, Pseudocyphellar aspis, Ramalina dilacerata, Sphaerophorus globosus, Usneafilipendula, Usnea scabrata, Usnea wirthiiAlectoria imshaugii, Bryoria fremontii, Bryoria pseudofuscescens, Cetrariachlorophylla, Cetraria merrillii, Cetraria orbata, Cetraria platyphylla,Wet days: 89 (18)Dendriscocaulon sp., Hypogymnia imshaugii, Leptogium cellulosum,Letharia vulpina, Nephr oma helveticum, Nephr oma r esupinatum,Nodobryoria abbreviata, Nodobryoria oregana, Parmelia hygrophila,Parmelia sulcata, Pseudocyphellar ia anomala, P Parmeliopsis ambigua, Usnea glabrescens, Usnea substerilisLeptogium pseudofurfuraceum, Letharia columbiana, Physconia isidiigeraWet days: 70 (19)Candelaria concolor, Flavopunctelia flaventior, Melanelia glabra, Physcia biziana,Parmelia quercina, Wet days: 62 (18) Average numbers of wet days per year and precipitation (cm) are reported, followed by standard deviations inparentheses. Only species that are statistically significant indicators (p )Analysis, are reported. Nitrophytes are bolded and stratified foliose cyanolichens are underlined. GENERAL TECHNICAL REPORT PNW-GTR-737Figure 55„Temperature scores for northern and central California categorized by temperature zone. See figure 14 forecoregion codes. Lichen Bioindication of Biodiversity, Air Quality, and Climate: Baseline Results From Monitoring...The northern and central California climate model was applied to a full cycle ofdescribe landscape-scale macroclimatic patterns. About 80 percent of these plotswere summarized by Jovan and McCune (2004) although the former study had adifferent objective and analytical approach. Large-scale climate patterns are dis-defined by Jovan and McCune (2004) for air quality studies (fig. 53). The distribu-tion of climate scores reflects how forests in the greater Central Valley tend to behot and dry compared to the warm and wet conditions of the marine-influencedNorthwest Coast. Forests in the greater Sierra Nevada are relatively cool overall,whereas moisture levels are more variable.Spatial Temperature PatternsThe spatial heterogeneity of lichen-derived temperature zones in northern and cen-tral California roughly echoes the underlying topography. The warm forests ofzone 1 are predominantly distributed among the low-elevation landforms of thenitrophyte-rich greater Central Valley model area but extend, to a lesser extent,into low elevations in the Northwest Coast (figs. 52 and 55). Plots in the latterregion include a higher diversity of temperature regimes with forests classifiedfrom all four zones. Cooler zone 3 and 4 forests are distributed widely outsidethe greater Central Valley, primarily in the mid to high elevations of the variousmountain ranges. A more-or-less continuous aggregation of these cooler forests lieswithin the greater Sierra Nevada model area, beginning in the eastern, high-elevation Klamath Range, and incorporating sites on the Modoc Plateau, southernCascades Range, Tahoe Basin, and Sierra Nevada Range.Spatial Moisture Patternswhereas forests of the greater Central Valley are almost entirely classified amongthe dry zones 3 and 4 (fig. 56). Moisture differs latitudinally in the greater SierraNevada, with forests getting drier to the south. The northern half of this region hasforests with a wider variety of moisture regimes, including sizeable pockets of wet GENERAL TECHNICAL REPORT PNW-GTR-737 GENERAL TECHNICAL REPORT PNW-GTR-737AcknowledgmentsThis report is the culmination of many peoples efforts. The Lichen CommunityIndicator in the Pacific coastal states is made possible by the hard work of over35 skilled lichen surveyors, lichenologists, and lichen identification specialists.Funding was provided by the Pacific Northwest Research Station ForestInventory and Analysis (PNW-FIA) through the Oregon State University (OSU)Department of Botany and Plant Pathology. Bruce McCune (OSU) and SallyCampbell (PNW-FIA) reviewed the report, in addition to providing considerableadvice and input throughout report development. Linda Geiser (PNW Air Pro-gram), Susan Will-Wolf (University of Wisconsin Madison), Peter Neitlich (Na-tional Park Service), Paul Patterson (Interior West-FIA), and Olaf Kuegler(PNW-FIA) graciously provided formal reviews and invaluable guidance. Allmaps were developed by geogrphic information systems specialist Elaina Graham(PNW-FIA), and John Chase (PNW-FIA) advised on the early stages of map-Linda Geiser, Peter Neitlich, Dale Weyermann (PNW-FIA), Ron Wanek(PNW-FIA), and Susan Will-Wolf all provided assistance obtaining or processingdata while J. Robert Johnson (UCLA-Riverside) provided preliminary modeled Ndata from the CMAQ model. Photo illustrations were provided by many talentedphotographers: Roseann Barnhill (www.redskystudio.org), Dr. Christopher Bochna,Karen Dillman, Griffen McKinney, Eric Peterson (www.crustose.net), Jim Riley,Judy Robertson, Roger Rosentreter, Daphne Stone, Eric Straley, and Tim Wheeler.English EquivalentsWhen you know:Multiply by:To get:Centimeters (cm)0.394Meters (m)3.28Kilometers (km)0.621Kilograms (kg)2.205PoundsHectares (ha)2.47)0.386Square milesDegrees celsius (°C)1.8°C + 32Degrees Farenheit GENERAL TECHNICAL REPORT PNW-GTR-737Cahill, T.A.; Carroll, J.J.; Campbell, D.; Gill, T.E. 1996. Air quality instatus ofthe Sierra Nevada, U.S. Geological Survey Digital Data Series, Sierra NevadaEcosystem Project; final report to Congress. Davis, CA: University of Califor-nia Centers for Water and Wildland Resources: 1227…1261. Vol. II. Chapter 48.http://ceres.ca.gov/snep/pubs/web/PDF/VII_C48.PDF. (August 22, 2007).California Climate Change Center. 2006a.risks to California. http://www.energy.ca.gov/2006publications/CEC-500-2006-077/CEC-500-2006-077.PDF. (August 22, 2007).California Climate Change Center. 2006b. Scenarios of climate change inCalifornia: an overview. http://www.energy.ca.gov/2005publications/CEC-500-2005-186/CEC-500-2005-186-SF.PDF. (August 22, 2007).California Environmental Protection Agency, Air Resources Board. 2005.Characterization of ambient PM10 and PM2.5 in California. Tech. Rep.June 2005. http://www.arb.ca.gov/pm/pmmeasures/pmch05/pmch05.htm.Campbell, S.J.; Wanek, R.; Coulston, J.W. 2007. Ozone injury in west coastGen. Tech. Rep. PNW-GTR-722. Portland, OR:U.S. Department of Agriculture, Forest Service, Pacific Northwest ResearchDaly, C.; Taylor, G. 2000. United States average monthly or annual precipita-tion, temperature, and relative humidity 1961-90. Arc/INFO Coverages.Spatial Climate Analysis Service, Oregon State University (SCAS/OSU),Corvallis, OR.Daly, C.; Taylor, G.H.; Gibson, W.P.; Parzybok, T.W.; Johnson, G.L.;Pasteris, P. 2001. High-quality spatial climate data sets for the United Statesand beyond. Transactions of the American Society of Agricultural Engineers.Davis, F.W.; Stoms, D.M; Hollander, A.D.; Thomas, K.A.; Stine, P.A.; Odion,D.; Borchert, M.I.; Thorne, J.H.; Gray, M.V.; Walker, R.E.; Warner, K.;Graae, J. 1998. The California Gap Analysis Project; final report. SantaBarbara, CA: University of California. http://www.biogeog.ucsb.edu/projects/gap/gap_rep.html. (August 22, 2007). GENERAL TECHNICAL REPORT PNW-GTR-737Fenn, M.E.; Baron, J.S.; Allen, E.B.; Rueth, H.M.; Nydick, K.R.; Geiser, L.;Bowman, W.D.; Sickman, J.O.; Meixner, T.; Johnson, D.W.; Neitlich, P. Ecological effects of nitrogen deposition in the Western United States.Fenn, M.E.; Haeuber, R.; Tonnesen, G.S.; Baron, J.S.; Grossman-Clarke, S.;Hope, D.; Jaffe, J.A.; Copeland, S.; Geiser, L.; Rueth, H.M.; Sickman,J.O. 2003b. Nitrogen emissions, deposition, and monitoring in the WesternFenn, M.E.; Poth, M.A.; Bytnerowicz, A.; Sickman, J.O.; Takemoto, B.K.Effects of ozone, nitrogen deposition, and other stressors on montaneecosystems in the Sierra Nevada. In: Bytnerowicz, A.; Arbaugh, M.J.; Alonso,R., eds. Ozone air pollution in the Sierra Nevada„distribution and effects onforests. Oxford, United Kingdom: Elsevier Science Ltd.: 111…155.Frati, L.; Santoni, S.; Nicolardi, V.; Gaggi, C.; Brunialti, G.; Guttova, A.;Gaudino, S.; Pati, A.; Pirintsos, S.A.; Loppi, S. 2007. Lichen biomonitoringof ammonia emission and nitrogen deposition around a pig stockfarm. Environ-Gauslaa, Y. 1985. The ecology of Lobaria pulmonariaeParmelion caperatae inQuercus dominated forests in south-west Norway. Lichenologist. 17: 117…140.Geiser, L. 2004. Manual for monitoring air quality using lichens on national forestsof the Pacific Northwest. Tech. Pap. R6-NR-AQ-TP-1-04. Portland, OR: U.S.Department of Agriculture, Forest Service, Pacific Northwest Region. 126 p.Geiser, L.; Neitlich, P.N. 2007. Air pollution and climate gradients in westernOregon and Washington indicated by epiphytic macrolichens. EnvironmentalGeiser, L.H.; Glavich, D.A.; Mikulin, A.G.; Ingersoll, A.R.; Hutten, M. 2004:New records of rare and unusual coastal lichens from the U.S. Pacific North-west. Evansia. 21(3): 104…110. An alkaline dust effect on epiphytic lichens. The Field evidence for an acid rain effect on lichens. Environ- GENERAL TECHNICAL REPORT PNW-GTR-737Jovan, S.; McCune, B. 2005. Air-quality bioindication in the greater CentralValley of California, with epiphytic macrolichen communities. EcologicalJovan, S.; McCune, B. 2006. Using epiphytic macrolichen communities forbiomonitoring ammonia in forests of the greater Sierra Nevada, California.Water, Air, and Soil Pollution. 170: 69…93.Jovan, S.; Carlberg, T. 2007. Letharia vulpina tissue fromforests of the Sierra Nevada, California: geographic patterns and relationships toammonia estimates and climate. Environmental Monitoring and Assessment.129: 243…251.Keon, D.B.; Muir, P.S. 2002. Growth of across a variety ofhabitats in the Oregon Coast Range. The Bryologist. 105: 233…242.Kruskal, J.B. 1964. Non-metric multidimensional scaling: a numerical method.Lambley, P.; Wolseley, P.; eds. 2004. Lichens in a changing pollution environmentNature, Northminster House. 121 p. http://www.english-nature.org.uk/pubs/Lambley, P.; Wolseley, P.; James, P. 2004. The impact of a changing pollutionclimate on the conservation of lichen-rich sites in England and the UK. In:Lambley, P.; Wolseley, P., eds. 2004. Lichens in a changing pollution environ-English Nature, Northminster House: 107…116. http://www.english-nature.org.uk/pubs/publication/PDF/525.pdf. (August 22, 2007).Lipow, S.R.; Vance-Borland, K.; St. Clair, J.B.; Henderson, J.; McCain, C. Gap analysis of conserved genetic resources for forest trees. ConservationBiology. 18: 412…423. Mapping the effects of air pollution, nitrogen deposition, agricul-ture and dust by the diversity of epiphytic lichens in central Italy. In: Lambley,P.; Wolseley, P., eds. 2004. Lichens in a changing pollution environmentNature, Northminster House: 37…41. http://www.english-nature.org.uk/ GENERAL TECHNICAL REPORT PNW-GTR-737Momsen, J.H. 2001. Agriculture in the Sierra in Status of the Sierra Nevada, U.S.Geological Survey Digital Data Series, Sierra Nevada Ecosystem Project; finalreport to Congress. Davis, CA: University of California Centers for Water andWildland Resources: 497…528. Vol. II. Chapter 17. http://ceres.ca.gov/snep/pubs/web/PDF/VII C17.PDF. (August 22, 2007).Mote, P.W.; Parson, E.A.; Hamlet, A.F.; Keeton, W.S.; Lettenmaier, D.;Mantua, N.; Miles, E.L.; Peterson, D.W.; Slaughter, R.; Snover, A.K. Preparing for climatic change: the water, salmon, and forests of thePacific Northwest. Climatic Change. 61: 45…88.Nash, T.H., III; Olafsen, A.G. 1995: Climate change and the ecophysiologicalresponse of Arctic lichens. Lichenologist. 27: 559…565.Nimis, P.L.; Scheidegger, C.; Wolseley, P.A.; eds. 2002. Monitoring with lichens-monitoring lichens. NATO Science Series. IV. Earth and Environmental Sci-ences, 7. The Netherlands: Dordrecht, Kluwer Academic Publishers. 408 p.Nylander, W. 1866. Les lichens du Jardin de Luxembourg. Bulletin de la Société Are ordination and constrained ordination alternative orcomplementary strategies in general ecological studies? Journal of VegetationOregon Department of Fish and Wildlife. 2006. The Oregon conservationstrategy. Oregon Department of Fish and Wildlife. http://www.dfw.state.or.us/conservationstrategy/document_pdf.pdf. (August 22, 2007).Parmesan, C.; Yohe, G. 2003. A globally coherent fingerprint of climate changePettersson, R.B.; Ball, J.P.; Renhorn, K.E.; Esseen, P.A.; Sjöberg, K. 1995.Invertebrate communities in boreal forest canopies as influenced by forestryand lichens with implications for passerine birds. Biological Conservation.Pirintsos, S.A.; Loppi, S.; Dalaka, A.; De Dominicis, V. 1998. Effects ofgrazing on epiphytic lichen vegetation in a Mediterranean mixed evergreensclerophyllous and decidous shrubland (northern Greece). Israel Journal of GENERAL TECHNICAL REPORT PNW-GTR-737Thomas, C.D.; Cameron, A.; Green, R.E.; Bakkenes, M.; Beaumont, L.J.;Collingham, Y.C.; Erasmus, B.F.N.; Ferreira de Siqueira, M.; Grainger,A.; Hannah, L.; Hughes, L.; Huntley, B.; van Jaarsveld, A.S.; Midgley,G.F.; Miles, L.; Ortega-Huerta, M.A.; Peterson, A.T.; Phillips, O.L.;Williams, S.E. 2004. Extinction risk from climate change. Nature. 427:Torn, M.S.; Harte, J. 2006. Missing feedbacks, asymmetric uncertainties, and theunderestimation of future warming. Geophysical Research Letters. 33: L10703.U.S. Department of Agriculture, Forest Service. [USDA FS]. 2005. Fieldinstructions for the annual inventory of Washington, Oregon, California, andAlaska: supplement for phase 3 (FHM) indicators. Portland, OR: Pacific North-west Research Station. 136 p. http://www.fs.fed.us/pnw/fia/local-resources/pdf/field_manuals/2005_annual_manual_supplement.pdf. (May 3, 2007).Van Dobben, H.F.; de Bakker, A.J. 1996. Re-mapping of lichen biodiversity inThe Netherlands: effects of decreasing SO and increasing NH. Acta BotanicaVan Herk, C.M. 1999. Mapping of ammonia pollution with epiphytic lichens inVan Herk, C.M. 2001. Bark pH and susceptibility to toxic air pollutants as inde-pendent causes of changes in epiphytic lichen composition in space and time.Van Herk, C.M.; Aptroot, A.; van Dobben, H.F. 2002. Long-term monitoring inthe Netherlands suggests that lichens respond to global warming. Lichenologist.34(2): 141…154.Van Herk, C.M.; Mathijssen-Spiekman, E.A.M.; de Zwart, D. 2003. Longdistance nitrogen air pollution effects on lichens in Europe. Lichenologist.35(4): 347…359.Vitousek, P.M.; Aber, J.D.; Howarth, R.W.; Likens, G.E.; Matson, P.A.;Schindler, D.W.; Schlesinger, W.H.; Tilman, G.D. 1997. Human alterationof the global nitrogen cycle: causes and consequences. Ecological Applications. Pacific Northwest Research StationWeb sitehttp://www.fs.fed.us/pnwTelephonePublication requestsFAXPacific Northwest Research StationP.O. Box 3890