/
COVID19 IMPACT AND RECOVERYMay 4 2022 COVID19 IMPACT AND RECOVERYMay 4 2022

COVID19 IMPACT AND RECOVERYMay 4 2022 - PDF document

sophie
sophie . @sophie
Follow
343 views
Uploaded On 2022-09-03

COVID19 IMPACT AND RECOVERYMay 4 2022 - PPT Presentation

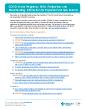
RESPONSE EMERGENCY ASSISTANCE DEMAND COVID19 RENTAL RELIEF UPDATE WEEK OF APR 25MAY 1 APPLICATIONS BY WEEK ENDED 1231 11032 total applicationsexcluding 3879 duplicate applications in grey AP ID: 947292

covid19 data vaccinations county data covid19 county vaccinations population dose week received maryland montgomery dhhs total cdc doses kits

Share:

Link:

Embed:

Download Presentation from below link

Download Pdf The PPT/PDF document "COVID19 IMPACT AND RECOVERYMay 4 2022" is the property of its rightful owner. Permission is granted to download and print the materials on this web site for personal, non-commercial use only, and to display it on your personal computer provided you do not modify the materials and that you retain all copyright notices contained in the materials. By downloading content from our website, you accept the terms of this agreement.


Presentation Transcript

COVID19 IMPACT AND RECOVERYMay 4, 2022 RESPONSE: EMERGENCY ASSISTANCE & DEMAND COVID19 RENTAL RELIEF UPDATE: WEEK OF APR 25MAY 1 APPLICATIONS BY WEEK (ENDED 12/31 11,032 total applications(excluding 3,879 duplicate applications in grey) APPLICANT CHARACTERISTICSmatched with landlord application53% unemployed past 90 daysneeded to care for self/others23% selfreported receiving an eviction noticeMedian household income: $21,159 APPLICANT HOUSEHOLD CHARACTERISTICS COVID19 RENTAL RELIEF UPDATE: WEEK OF APR 25MAY 1 APPLICATION PROCESSING* Denied33%Assigned/under review1%Processed66%*Application processing has slowed due to switch in processing systems. Denials are primarily due t

o applicants not having arrears/mortgage assistance requests, exceeding income requirements, not demonstrating county residency, and include nonresponsive and fraudulent requests. ALLTIME TOTALSThe current round of funding adds to two previous rounds of COVID19 assistance. In total, the Emergency Rental Assistance Program has approved:77.5in payments10,455households APPROVALSThe number of households and payments have decreased as most applications from this round have been processed. 0.3M1.1M1.8M1.2M1.7M1.3M2.1M1.1M2.1M1.7M1.5M1.5M1.1M1.4M1.1M0.8M1.6M1.7M1.2M1.9M1.7M0.2M0.4M5-316-146-287-127-268-98-239-69-2010-4 10-18 11-1 11-15 11-29 12-13 12-27 1-101-242-72-213-73-214-44-1

8Total Approved Payments: $59.6M(4day workweek in light blue) 2499182129179122208109198165142140109145106731701811152001762541 5-31 6-14 6-28 7-12 7-26 8-9 8-23 9-6 9-20 10-4 10-18 11-1 11-15 11-29 12-13 12-27 1-10 1-24 2-7 2-21 3-7 3-21 4-4 4-18 Total Approved Households: 5,959(4day workweek in light blue) COVID19 RENTAL RELIEF UPDATE: WEEK OF APR 25MAY 1 HEATMAP OF RECIPIENT HOUSEHOLDS RECIPIENT RACE/ETHNICITY ADDITIONAL RECIPIENT CHARACTERISITICSAverage client payment: 64% of payments arrears;36% prospective44% of awarded households are in highneed areas as defined by the Homeless Prevention Index COVID19 RENTAL RELIEF UPDATE: WEEK OF APR 25MAY 1 ERAP1 EXPENDITURESAward

*$59.5MCurrent spending and encumbered$59.5M* Total ERAP1 includes direct and state funding. OF FUNDS ERAP2 EXPENDITURESAward.1MCurrent spending and encumbered OF FUNDSNote: Spending and percentages may shift as payments are reconciled. STATE EXPENDITURES BY COUNTY (ERAP1) MontgomeryPrince George'sBaltimore CityWicomicoWashingtonCecilCharlesAnne ArundelWorcesterSt. Mary'sAlleganyTalbotCarrollCalvertCarolineDorchesterQueen Anne'sSomersetGarrettKentBaltimore CountyFrederickAs of 3.31.2022Source: Maryland Department of Housing and Community Development, https://bit.ly/3DQSVZV EVICTION TRACKER NEW WRITS BY WEEK 1,017 residents scheduled for eviction after July 1945% of household

s with writ have applied for emergency rental assistanceContext: fewer than 8% of writs typically result in eviction NOTE: Records on writs for eviction can include commercial tenants as well as multiple notices for a single household. The stats above attempt to capture unique residential households only , but it is not always possible to make such distinctions. SHELTER OCCUPANCYNOTE: Up to March 7, total occupancy did not include MCCHaffiliated hotels providing shelter to those who are in quarantine or isolation. MC311 WEEKLY CALL VOLUME: DHHS WEEKLY CALLS BY DEPARTMENT1,323 calls last week for DHHS services % of last week’s DHHS service calls were regarding public ass

istance programsMost questions regarding public assistance are referred to the Office of Eligibility and Support Services, which in March fielded 2,678 direct calls and 2,789 referrals from MC311% of DHHS calls to MC311 were about the COVID Rental Relief Program MC311 WEEKLY CALL VOLUME: DHHS PUBLIC HEALTHcalls last week for Public Healthrelated to COVID SERVICES TO END & PREVENT HOMELESSNESScalls last week for SEPHrelated to COVID UNEMPLOYMENT RATES IN THE REGION 3.22.62.52.93.17.78.68.68.26.76.65.95.75.76.45.74.94.33.83.99.45.85.05.65.04.23.74.03.62.32.01.92.22.210.28.18.56.75.65.54.83.64.13.72.72.32.92.30%2%4%6%10% Jul '19 Aug '19 Sep '19 Oct '19Nov '19 Dec '19 Jan '20 Fe

b '20 Mar '20 Apr '20 May '20 Jun '20 Jul '20 Aug '20 Sep '20 Oct '20Nov '20 Dec '20 Jan '21 Feb '21 Mar '21 Apr '21 May '21 Jun '21 Jul '21 Aug '21 Sep '21 Oct '21Nov '21 Dec '21 Jan '22 Feb '22 Mar '22 Montgomery County DC-Metro Region Fairfax County COVID19 CASES, VACCINATIONS, & TESTING COVID19 COMMUNITY LEVEL STATUSBased on CDC’s community level indicators, Montgomery County’s community level status is LOW. Fewer than 200 cases per 100k in the past seven daysFewer than 10 new COVIDadmissions per 100k in the past seven daysLess than 10% of staffed inpatient beds occupied by COVID19 patients on average in the past seven days For realtime updates, visit the COVID

19 Surveillance Dashboard: https://www.montgomerycountymd.gov/covid19/data/ COVID19 CASES Note: Case data only reflect confirmed cases via PCR tests. COVID19 HOSPITALIZATIONS There are 37 hospitalized COVIDpatients as of 5/2. Acute care occupancy (20) has decreased since last week (4) and ICU bed occupancy (3) has remained the same.3% of hospital beds in the community are occupied by patients with a COVID diagnosis (as of 5/2).14 patients are currently hospitalized at the alternate care site. These patients are transfers from other hospitals and may come from other jurisdictions.For realtime updates, visit the COVID19 Surveillance Dashboard: https://www.montgomerycountymd.go

v/covid19/data/ COVID19 DEATHSVSA revised death data on May 27, to include COVID19 deaths not previously counted.NOTE: Monthly totals are based on the date death was reported, which may not be the same as the date on which the death occurred 1,0671,3331,2421,2401,7542004006008001,0001,2001,4001,6001,8002,000 Mar '20 Apr '20 May '20 Jun '20 Jul '20 Aug '20 Sep '20 Oct '20 Nov '20 Dec '20 Jan '21 Feb '21 Mar '21 Apr '21 May '21 Jun '21 Jul '21 Aug '21 Sep '21 Oct '21 Nov '21 Dec '21 Jan '22 Feb '22 Mar '22 Apr '22 Monthly COVID19 DeathsUpdated 4/29/22 Montgomery County Maryland HOSPITALIZATIONS & DEATHS BY VACCINATION STATUSNOTE: Hospitalization rates for the boosted populatio

n are not available. COVID19 VACCINATIONS: TOTALS FROM CDC TOTAL VACCINATIONS (AS OF 5/2/22)≥95%of total population received at least ONE DOSE [N=1,072,378]of total population received at least TWO DOSES (fully vaccinated) [N=915,750]of fully vaccinated population received FIRST BOOSTER/ADDITIONAL DOSE [N=498,462]*The CDC caps percentages at 95% to account for margins of error in data entry and population estimates.NOTE: On 4/15/22, Maryland made updates to previously submitted data to the CDC that resulted in a decrease of 50,176 doses administered. Some percentages may have decreased as a result. NOTE: The CDC vaccination count includes Montgomery County residents who re

ceived their shots in Maryland or outside the state. It also includes vaccinations administered in some federal entities within Montgomery County. VACCINATIONS BY AGE GROUP AGE 12+AGE 5+AGES 12-17AGES 5-11 At Least 1 Fully VaccinatedChart reflects percent of total age group population that received doses. Percentage estimates are reflected as ranges for ages 1217 and ages 511 due to higher margins of error. 58% of the fully vaccinated 12+ population received a FIRST BOOSTER/ADDITONAL DOSE [N=498,241]78% of the fully vaccinated 65+ population received a FIRST BOOSTER/ADDITIONAL DOSE [N=131,333] COVID19 VACCINATIONS: WEEKLY VOLUME Charts below show most recent full weeks of da

ta, up to April 24, 2022. VACCINATIONS BY DOSE ADDITIONAL DOSES BY AGE GROUP A first booster is defined as the third in a series of two Pfizer or Moderna doses, or the second if recipient received J&J as first dose. A second booster is defined as either the third or fourth dose, depending on whether recipient received J&J as initial dose. Doses are counted without regard to date. Total counts are estimations and imprecise due to entry errors and missing doses for Marylanders who received any of their doses out of state.Unlike the CDC vaccination data, data from Maryland Health Department only include Montgomery County residents who were vaccinated in Maryland. Totals do not

include vaccinations administered at federal entities within the county to nonresidents. COVID19 VACCINATIONS: GAPS TRACTS WITH BELOW AVERAGE FIRSTDOSE RATES Across the highlighted tracts above, 30% of the population is White nonHispanic, 30% is Black nonHispanic, 24% is Hispanic, and 12% is Asian/Pacific Islander. FIRSTDOSE VACCINATION RATES BY RACE ADDITIONAL DOSE RATES BY RACE & AGE COVID19 VACCINATIONS: PEDIATRIC VACCINATIONS FIRST DOSES BY RACE/ETHNICITY Charts reads: 20% of 511 population are NH Black, and 16% of vaccinated 511 population are NH Black.1% of vaccinated children identify as Native American; they are included in the “Other” category. Approximate

ly 3% of pediatric records do not contain race/ethnicity information. PEDIATRIC VACCINE PROVIDERS Pediatric vaccinations are distributed evenly between Montgomery County DHHS (in partnership with MCPS, physicians and medical clinics, and pharmacies and grocery stores. FIRSTDOSE VACCINATION RATES BY ZIP CODEVaccination rates among residents ages 514 are used as a proxy for pediatric vaccination rates in the map below due to the availability of population estimates only for certain age categories. Zip codes with fewer than 100 residents ages 514 are excluded. COUNTY GOVT COORDINATED TESTING & VACCINATIONS DHHSADMINISTERED TESTING: 2,325 TESTS ADMINISTERED LAST WEEK DHHSADMINIS

TERED VACCINATIONS: 1,249 DOSES ADMINISTERED LAST WEEK 1.9K1.6K1.6K1.4K1.3K1.2K1.5K1.3K4.7K12.8K11.0K9.9K6.7K8.5K3.5K2.5K1.3K1.0K6312.0K1.6K1.2K7/6 7/12 7/19 7/26 8/28/9 8/16 8/23 8/30 9/6 9/13 9/20 9/27 10/4 10/11 10/18 10/25 11/1 11/8 11/15 11/22 11/29 12/6 12/13 12/20 12/27 1/3 1/10 1/17 1/24 1/31 2/7 2/14 2/21 2/28 3/7 3/14 3/21 3/28 4/4 4/11 4/18 4/25 Pediatric second dose Pediatric first dose Adult additional dose Adult second dose Adult first dose or single doseData are subject to retroactive changes. The current data collection system does not distinguish between first and second booster shots. DISTRIBUTION OF MASKS & RAPID TESTS ,144,000 rapid tests have been acquir

ed by the CountyMore than 1.6M kits have been distributed1,001,652 kits and 1,236,809 masks have been distributed at librariesTest kits and masks are now available during all hours that libraries are open.490,280 rapid test kits have been provided to MCPS136,512 test kits & 235,603 masks distributed to childcare, private schools, and community nonprofits48,090 rapid test kits and 124,446 N95 masks have been distributed through municipalities DATA SOURCESThis report aggregates data from several sources, some of which are publicly available. Nearly all data are subject to retroactive changes.Rental assistance data is generated by DHHS each Sunday prior to the publication of th

is report.Data on evictions are provided by the Montgomery County Sheriff’s Office each Monday for the week prior.Data on shelter occupancy are collected by DHHS weekly.MC311 data are downloaded weekly from DataMontgomery Unemployment data are downloaded monthly from Case and hospital occupancy data are provided by Maryland Department of Health. Realtime data can be found on the Montgomery County COVID19 Surveillance DashboardData on COVID19 deaths are available through the Maryland Department of Health dashboard and ArcGIS platform.Data on hospitalizations and deaths by vaccination status are available on the DHHS COVID19 websiteVaccine data are downloaded from the

CDC website each Tuesday morning. More detailed vaccine data are provided by the Maryland Department of Health Immunetdatabase on a weekly basis.Data on county government coordinated testing and vaccinations are collected by DHHS daily. DATA SOURCESThis report aggregates data from several sources, some of which are publicly available. Nearly all data are subject to retroactive changes.Rental assistance data is generated by DHHS each Sunday prior to the publication of this report.Data on evictions are provided by the Montgomery County Sheriff’s Office each Monday for the week prior.Data on shelter occupancy are collected by DHHS weekly.MC311 data are downloaded weekly f

rom DataMontgomery Unemployment data are downloaded monthly from Case and hospital occupancy data are provided by Maryland Department of Health. Realtime data can befound on the Montgomery County COVID19 Surveillance DashboardData on COVID19 deaths are available through the Maryland Department of Health dashboard and ArcGIatform.Data on hospitalizations and deaths by vaccination status are available on the DHHS COVID19 websiteVaccine data are downloaded from the CDC website each Tuesday morning. More detailed vaccine data areprovided by the Maryland Department of Health Immunetdatabase on a weekly basis.Data on county government coordinated testing and vaccinations are c

ollected by DHHS daily. DISTRIBUTION OF MASKS & RAPID TESTS ,144,000 rapid tests have been acquired by the CountyMore than 1.6M kits have been distributed1,001,652 kits and 1,236,809 masks have been distributed at librariesTest kits and masks are now available during all hours that libraries are open.490,280 rapid test kits have been provided to MCPS136,512 test kits & 235,603 masks distributed to childcare, privathools, and community nonprofits48,090 rapid test kits and 124,446 N95 masks have been distributedthrough municipalities COVID19 VACCINATIONS: TOTALS FROM CDC TOTAL VACCINATIONS (AS OF 5/2/22)≥95%of total population received at leasE DOSE [N=1,072,378]of total pop

ulation received at leasO DOSES (fully vaccinated) [N=915,750]of fully vaccinated population receivedFIRST BOOSTER/ADDITIONAL DOSE[N=498,462]*The CDC caps percentages at 95% to account for margins of error in data entry andpopulation estimates.NOTE: On 4/15/22, Maryland made updates to previously submitted data to the CDC that resulted in a decrease of 50,176 doses administered. Some percentages may have decreased as a result. NOTE: The CDC vaccination count includes Montgomery County residents who received their shots in Maryland or outside the state. It also includes vaccinations administered in some federal entities within Montgomery County. VACCINATIONS BY AGE GROUP AGE

12+AGE 5+AGES 12-17AGES 5-11 At Least 1 Fully VaccinatedChart reflects percent of total age group population that received doses. Percentage estimates are reflected as ranges for ages 1217 and ages 511 due to higher margins of error. 58% f the fully vaccinated 12+ population received a FIRST BOOSTER/ADDITONAL DOSE[N=498,241]78% f the fully vaccinated 65+ population received a FIRST BOOSTER/ADDITIONAL DOSE[N=131,333] COVID19 HOSPITALIZATIONS There are 37 hospitalized COVIDatients as of 5/2. Acute careoccupancy (20) has decreased sincelast week (4) and ICU beccupancy (3) has remained thesame.3% of hospital beds in thecommunity are occupied by patienth a COVID diagnosis (as of

5/2).14 patients are currentlyhospitalized at the alternate caresite. These patients are transferrom other hospitals and may comefrom other jurisdictions.For realtime updates, visit the COVID19 Surveillance Dashboard: https://www.montgomerycountymd.gov/covid19/data/ COVID19 COMMUNITY LEVEL STATUSBased on CDC’s community level indicators, Montgomery County’s community level status is LOW. Fewer than 200 cases per 100k in thepast seven daysFewer than 10 new COVIDdmissions per 100k in the past sevendaysLess than 10% of staffed inpatient bedccupied by COVID19 patients onaverage in the past seven days For realtime updates, visit the COVID19 Surveillance Dashboard: https

://www.montgomerycountymd.gov/covid19/data/ COVID19 RENTAL RELIEF UPDATE: WEEK OF APR 25MAY 1 ERAP1 EXPENDITURESAward*$59.5MCurrent spending and encumbered$59.5Mtal ERAP1 includes direct and state funding. OF FUNDS ERAP2 EXPENDITURESAward34.1MCurrent spending and encumbered$6M OF FUNDSNote: Spending and percentages may shift as payments are reconciled. STATE EXPENDITURES BY COUNTY (ERAP1) MontgomeryPrince George'sBaltimore CityWicomicoWashingtonCecilCharlesAnne ArundelWorcesterSt. Mary'sAlleganyTalbotCarrollCalvertCarolineDorchesterQueen Anne'sSomersetGarrettKentBaltimore CountyFrederickAs of 3.31.2022Source: Maryland Department of Housing and Community Development, https://