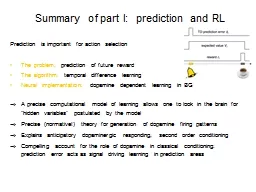
/
Prediction  of  Retweet  Cascade Size over Prediction  of  Retweet  Cascade Size over

Prediction of Retweet Cascade Size over - PowerPoint Presentation

sophie
sophie . @sophie
Follow
64 views
Uploaded On 2024-01-29

Prediction of Retweet Cascade Size over - PPT Presentation

Time Andrey Kupavskii Liudmila Ostroumova Alexey Umnov Svyatoslav Usachev Pavel Serdyukov Gleb Gusev Andrey ID: 1041802

prediction cascade features retweets cascade prediction retweets features initial moment retweet tweet user number spread graph time users pagerank

Share:

Link:

Embed:

Download Presentation from below link

Download Presentation The PPT/PDF document "Prediction of Retweet Cascade Size ov..." is the property of its rightful owner. Permission is granted to download and print the materials on this web site for personal, non-commercial use only, and to display it on your personal computer provided you do not modify the materials and that you retain all copyright notices contained in the materials. By downloading content from our website, you accept the terms of this agreement.


Presentation Transcript

1. Prediction of Retweet Cascade Size over TimeAndrey Kupavskii, Liudmila Ostroumova, Alexey Umnov, Svyatoslav Usachev, Pavel Serdyukov, Gleb Gusev, Andrey Kustarev {kupavskiy, ostroumova-la, umnov, kaathewise, pavser, gleb57, kustarev}@yandex-team.ruThe second one: we also utilize the information about the spread of the cascade up to moment T0. Algorithm:We train gradient boosted decision tree models. One of them approximates the natural logarithm of the size of the cascade at the moment T, minimizing mean square root error. Two others do binary classification that sorts out large epidemics: tweets that gained more than 4000 retweets and [1600,3999] retweets.Features:Social and time-sensitive features of the initial node, content features, features of the infected nodes up to the moment T0.Experimental results:Conclusions:The prediction have high precision.If you use the initial spread of thed tweet, the quality of the prediction increases significantly.New features like PageRank in thed retweet graph or the flow of the cascade are important for the prediction.PageRank in the retweet graph can be used as a measure of user influence.Future work: Analysis of other measures of tweet popularityStudy of the cascade growth in more detailComparison of different measures of user influenceModeling the tweet spread from the epidemiological point of viewTakeaway: wait for 30 seconds to make the prediction much more precise New features:PageRank in the retweet graph: The vertices of the retweet graph are users, we have an edge (A,B) with weight w, if user B retweeted user A w times. We calculate PageRank for both weighed and unweighed graph.The flow of the cascade:For each edge from participating user to his follower we define the activity of the follower and the edge which depends on time. Informally, the flow of the initial part of a cascade is the sum of activities over all edges between participating users and their followers.Other features:Average local and global retweet ratios of the initial user up to the moment T, the number of retweets at the moment T0, sum of average retweet ratios, PageRanks, and the total number of followers of the infected users at the moment T0,Motivation: sociology, breaking news detection, viral marketing, freshness of the search engine layout. Viral marketing: You spread an advertisement and you want to get 1000 retweets within a day. You choose the set of initial users and then you can try to predict, whether you get 1000 retweets or not. If you wait for some time and use the information about the initial spread of the cascade, then you can make the prediction more accurate.Prediction: We predict the number of retweets the tweet will gain during the time T since the initial tweet.Two variants of the prediction task: The first one: we utilize only the information available at the moment of the initial tweet. Baseline+ New featuresT0=0, T=15m 0.9810.957T0=0, T=1w 1.2431.226T0=15s, T=15m 0.9810.796T0=15s T=1w 1.2431.050T0=30s, T=15m 0.9810.588T0=30s, T=1w 1.2430.838Tweet classBaselineallNo flowNo PR[1600,3999] 0.6590.7750.760.761≥40000.4360.670.6570.632 F1-score for the binary classification of two groups of tweets that gained the largest number of retweets using different sets of features . Mean square error of the logarithm of the predicted cascade size at moment T. If the error is equal to x, then, roughly speaking, the actual and predicted number of retweets on average differ in ex times.