/
Phase 2 of new ARVs Fostemsavir Phase 2 of new ARVs Fostemsavir

Phase 2 of new ARVs Fostemsavir - PowerPoint Presentation

sportyinds
sportyinds . @sportyinds
Follow
344 views
Uploaded On 2020-11-06

Phase 2 of new ARVs Fostemsavir - PPT Presentation

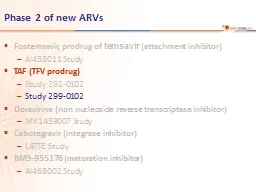
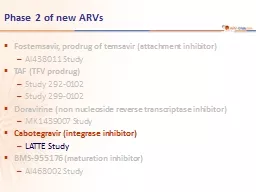
prodrug of temsavir attachment inhibitor AI438011 Study TAF TFV prodrug Study 2920102 Study 2990102 Doravirine non nucleoside reverse transcriptase inhibitor MK1439007 Study ID: 816609

cobi taf 299 tdf taf cobi tdf 299 0102 drv study hiv jaids change 439 2015 rna bone ratio

Share:

Link:

Embed:

Download Presentation from below link

Download The PPT/PDF document "Phase 2 of new ARVs Fostemsavir" is the property of its rightful owner. Permission is granted to download and print the materials on this web site for personal, non-commercial use only, and to display it on your personal computer provided you do not modify the materials and that you retain all copyright notices contained in the materials. By downloading content from our website, you accept the terms of this agreement.


Presentation Transcript

Slide1

Phase 2 of new ARVs

Fostemsavir

,

prodrug

of

temsavir

(

attachment inhibitor)

AI438011 Study

TAF (TFV

prodrug

)

Study 292-0102

Study 299-0102

Doravirine (non nucleoside reverse transcriptase inhibitor)

MK1439007 Study

Cabotegravir (integrase inhibitor)

LATTE Study

BMS-955176 (maturation inhibitor)

AI468002 Study

Slide2

Design

Objective

Primary endpoint : non inferiority of D/C/F/TAF at W24: % HIV RNA < 50 c/

mL

by intention to treat, snapshot analysis (lower margin of the 2 sided 95% CI for the difference = -12%)

Secondary endpoints : HIV RNA < 50 c/mL at W48, safety, tolerability

D/C/F/TAF STR 800/150/200/10 mg QDDRV 400 mg x 2 + COBI + F/TDF placebos QD

DRV 400 mg x 2 + COBI 150 mg + F/TDF 200/300 mg QDD/C/F/TAF STR QD placebo

Randomisation*2 : 1Double-blind

Adults ≥ 18 yearsARV-naïve HIV RNA > 5,000 c/mLCD4 cell count > 50/mm3eGFR ≥ 70 mL/minSensitive to DRV, FTC and TDF

* Randomisation was stratified by HIV RNA (< or > 100,000 c/mL) and race (black or nonblack)

Study GS-US-299-0102: D/C/F/TAF QD STR vs DRV + COBI + F/TDF QD

N = 50

N = 100

W24

W48

Mills A,

JAIDS 2015; 69: 439-45

GS-US-299-0102

D =

darunavir

; C =

cobicistat

; F = FTC

Slide3

D/C/F/TAF

N = 103

DRV + COBI

+ F/TDF

N = 50

Median age, years

31

36

Female

8%6%

Black

35%

34%

HIV RNA (log

10

c/

mL

), median

4.7

4.6

HIV RNA > 100,000 c/

mL

22%

14%CD4 cell count (/mm3), median368433CD4 < 200 per mm310.7%20%eGFR (Cockroft-Gault), mL/min, median116110Discontinuation by W4819 (18%)8 (16%)For investigator’s discretion10For adverse event22Lost to follow-up / Withdrew consent10 / 44 / 2Non-compliance20

Baseline characteristics and patient disposition

Study GS-US-299-0102: D/C/F/TAF QD vs DRV + COBI + F/TDF QD

Mills A, JAIDS 2015; 69: 439-45

GS-US-299-0102

Slide4

Response to treatment

HIV RNA < 50 c/

mL

, ITT, snapshot analysis

D/C/F/TAF

DRV + COBI + F/TDF

171/196174/19596/112

104/117703/753680/75025

50

1007574.8

74.0%

Adjusted

difference(95% CI)

= 3.3% (- 11.4 ; 18.1)

76.7

84.0

Primary analysis, W24

(Overall)

0

W48

Adjusted

difference

(95% CI)

= -6.2% (- 19.9 ; 7.4)D/C/F/TAFDRV + COBI+ F/TDFVirologic failure16%12%No data8%4%Outcome at W48D/C/F/TAFDRV + COBI+ F/TDFW24+ 186+ 139W48+ 231+ 212p : not significantCD4/mm3 responseStudy GS-US-299-0102: D/C/F/TAF QD vs DRV + COBI + F/TDF QDMills A, JAIDS 2015; 69: 439-45GS-US-299-0102

Slide5

Study GS-US-299-0102: D/C/F/TAF QD

vs

DRV + COBI + F/TDF QD

D/C/F/TAF

N = 103

DRV + COBI + F/TDF

N = 50

Virologic failure6 (5.8%)

2 (4%)

No emergence of resistance to TDF, FTC or DRVCriteria for resistance testing

Confirmed virologic failure : 2 consecutive HIV RNA > 50 c/mL and an HIV RNA > 400 c/mL at or after W8

Second, confirmatory, sample, tested for resistance

Resistance data at week 48

Mills A, JAIDS 2015; 69: 439-45

GS-US-299-0102

Slide6

D/C/F/TAF

DRV + COBI + F/TDF

Grade 3-4 AE

6.8%

8.0%

AEs (all grades) in ≥ 10% of patients in either group

Diarrhea

21.4%

26%

Upper respiratory tract infection

15.5%

14%

Fatigue

13.6%

18%

Nausea

12.6%

10%

Rash

11.7%

8%

Flatulence

4.9%

12%Pain in extremity7.8%10%Vitamin D deficiency1.9%10%Vomiting3.9%10%Serious AEs4.9%4.0%AE leading to discontinuationN = 2Rash;Substance dependanceN = 2Worsening of diarrhea ;Proximal renal tubulopathyStudy GS-US-299-0102: D/C/F/TAF QD vs DRV + COBI + F/TDF QDAdverse events by W48Mills A, JAIDS 2015; 69: 439-45GS-US-299-0102

Slide7

Renal outcome at W48

D/C/F/TAF

DRV + COBI + F/TDF

P

Mean (95% CI) change from baseline

in

creatinine

, mg/dL

+ 0.06 (0.04 - 0.08)

+ 0.09 (0.05 - 0.14)0.053Median decrease in

eGFR (

Cockroft-Gault),

mL/min

-2.9

-10.6

0.017

Median change in urine retinol binding protein/

creatinine

ratio, mg/g

+ 9%

+ 54%

0.003

Median change in urine beta-2

microglobulin/creatinine ratio, mg/g-42%+2.3%0.002Median change in urine albumin/creatinine ratio, mg/g-13.1%-22.6%0.17Median change in urine protein/creatinine ratio, mg/g-8.22%-27.52%0.19Median change in fractional excretion of phosphates+ 2.4%+ 1.8%nsEmergent dipstick proteinuria32%34%nsStudy GS-US-299-0102: D/C/F/TAF QD vs DRV + COBI + F/TDF QDMills A, JAIDS 2015; 69: 439-45GS-US-299-0102

Slide8

Mean

percentage

change

from

baseline in bone mineral density (DEXA)

Total hipLumbar spineBone sub-study outcome at W48

D/C/F/TAFDRV + COBI + F/TDF

P

BMD decline > 3% in hip18.3%61.7%

< 0.001

BMD decline > 3% in lumbar spine

32.5%

55.3%

0.002

P1NP (bone formation) increase

+ 4.7%

+ 52.5%

< 0.001

CTx

(bone

resorption

) increase

+ 23.2%+ 74.4%< 0.001P1NP : pro-collagen Type 1 N-terminal propeptide ; CTx : C-terminal telopeptideStudy GS-US-299-0102: D/C/F/TAF QD vs DRV + COBI + F/TDF QDMills A, JAIDS 2015; 69: 439-45GS-US-299-0102D/C/F/TAFDRV + COBI + F/TDFW24W48W24W48-0,53-0,84-2,09-3,82-1,09-1,57-3,82-3,62P < 0,001P = 0,003P < 0,001P < 0,001

Slide9

Median change in fasting metabolic parameters at Week 48

D/C/F/TAF

DRV + COBI + F/TDF

P

Total cholesterol, mg/dL

+ 40

+ 5

< 0.001

LDL-cholesterol, mg/

dL

+ 26

+ 4

< 0.001

HDL-cholesterol, mg/dL

+ 7

+ 3

0.009

Total cholesterol:HDL-cholesterol ratio

0.0

-0.2

0.15

Triglycerides, mg/dL

+ 29

-50.007Serum glucose, mg/dL+ 5+ 70.33Initiation of lipid lowering agent by W486.8%8%Study GS-US-299-0102: D/C/F/TAF QD vs DRV + COBI + F/TDF QDMills A, JAIDS 2015; 69: 439-45GS-US-299-0102

Slide10

Study GS-US-299-0102: D/C/F/TAF QD

vs

DRV + COBI + F/TDF QD

Mills A, JAIDS 2015; 69: 439-45

GS-US-299-0102

Conclusion

D/C/F/TAF had significantly improved renal and bone safety parameters than DRV + COBI + F/TDF in antiretroviral-naïve, HIV-1 infected subjects : Less proteinuriaLess change in hip and spine BMDStudy limitationsSmall sample sizeEach participant had to take 5 tablets (double-blind) not optimal for patient’s adherence and retention in the studyFew women enrolled

This D/C/F/TAF STR offers a promising option for initial HIV treatment, withThe high barrier to resistance of DRVAnd the potential for improved long-term renal and bone safety with TAF