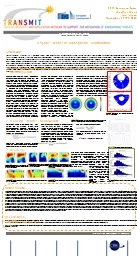
Cesaroni C 1 Spogli L 12 Aragon Angel A 3 Fiocca M 4 Dear V 5 De Franceschi G 1 Romano V 12 1 Istituto Nazionale di Geofisica e Vulcanologia Italy ID: 805048
Download The PPT/PDF document "Forecasting ionospheric Total Electron C..." is the property of its rightful owner. Permission is granted to download and print the materials on this web site for personal, non-commercial use only, and to display it on your personal computer provided you do not modify the materials and that you retain all copyright notices contained in the materials. By downloading content from our website, you accept the terms of this agreement.
Slide1
Forecasting ionospheric Total Electron Content at global level one day in advance Cesaroni C.1, Spogli L.1,2, Aragon-Angel A.3, Fiocca M.4, Dear V.5, De Franceschi G.1, Romano V.1,21Istituto Nazionale di Geofisica e Vulcanologia, Italy2SpacEarth Technology, Italy3European Commission, Joint Research Centre, Italy4Independent Researcher, Italy5National Institute of Aeronautics and Space, Indonesia
luca.spogli@ingv.it
Forecasting ionospheric Total Electron Content at global level one day in advance
Cesaroni et al. FeaturesEmpirical Forecasting horizon: 24 hrsPlanetary scaleTime res: 3 hrsIngredientsGlobal Iono Map maps by IGSNonlinear autoregressive neural network with external input (NARX) - supervisedEffective Sunspot Number R12effNeQuick2Kp forecasting by NOAATotal Electron Content modelValidationTesting against independent TEC measurementsStatistical assessmentDependence on geospace conditions“Frozen ionosphere”Figures of merit are providedImplementationIonospheric Prediction ServicePECASUS
Slide3Forecasting ionospheric Total Electron Content at global level one day in advance
Cesaroni et al. Model principlesStep 1Single point TEC forecasting Step 2Global TEC forecasting
Slide4Forecasting ionospheric Total Electron Content at global level one day in advance
Cesaroni et al. Model principlesStep 1Single point TEC forecasting For each grid point, a different NARX is trained by using 11 years long (2005-2015) TEC and Kp time series divided into training (70%), validation (15%) and testing (15%) datasets. All TEC time series are from Global Ionospheric Maps (final products) provided by IGS (time res is 2 hours). Kp time series is obtained by interpolating 3-hours resolution data to obtain a value of the Kp every 2 hours.Output of the step is TEC(t+24hrs) for each grid point
Slide5Forecasting ionospheric Total Electron Content at global level one day in advance
Cesaroni et al. Model principlesStep 2Global TEC forecasting Retrieving of R12eff (Olwendo and Cesaroni, 2016)
NeQuick2
[
Nava et al.
2006]on a regular grid 2.5°
lat x 5°lon
R12
eff
Slide6Forecasting ionospheric Total Electron Content at global level one day in advance
Cesaroni et al. Examples of output
Slide7Forecasting ionospheric Total Electron Content at global level one day in advance
Cesaroni et al. Model validationValidationTesting against independent TEC measurementsStatistical assessmentDependence on geospace conditions“Frozen ionosphere”Figures of merit are providedTEC provided as daily IONEX files by UPC as part of the International GNSS Service (IGS) Final Products*vTEC measured by the dual-frequency altimeter instrument on board the JASON-3 spacecraft * accuracy of about 5 TECu [Hernández-Pajares et al., 2009], provided weekly with a latency of about 11 days N grid points of the maps - (i,j) coordinates.
D
TEC =
TEC difference between the forecasted TEC and the corresponding IGS TEC map in the grid point (
i,j
).
Slide8Forecasting ionospheric Total Electron Content at global level one day in advance
Cesaroni et al. Model validation: statistical assessmentJune 2017 to May 2018
Slide9Forecasting ionospheric Total Electron Content at global level one day in advance
Cesaroni et al. Model validation: statistical assessmentJune 2017 to May 2018
Slide10Forecasting ionospheric Total Electron Content at global level one day in advance
Cesaroni et al. Model validation: statistical assessmentJune 2017 to May 2018
Slide11Forecasting ionospheric Total Electron Content at global level one day in advance
Cesaroni et al. Model validation: case eventsDate Max KpMin Dst (nT)NoteFigures of merit (TECu)msRMSE 08 Feb 20181+-1G0 – quiet time
-0.6
4.2
4.2
13-14 Jan 2018
5-
-14
G1 storm - CH
-0.6
3.3
3.4
07-12 Nov 2017
6+
-72
G2 storm – CH
0.04
5.1
5.1
26 Sep – 03 Oct 2017
7-
-75
G3 storm – CH
-0.9
4.0
4.1
27-31 May 2017
7
-125
G3 storm - CME
0.3
3.6
3.6
07-11 Sep 2017
8+
-142
G4 storm - CME
0.4
3.8
3.8
Forecasting ionospheric Total Electron Content at global level one day in advance
Cesaroni et al. Model validation: frozen ionosphereFrozen ionosphereModel
Slide14Forecasting ionospheric Total Electron Content at global level one day in advance
Cesaroni et al. Model Implementation in Real-Time serviceshttp://ips.gsc-europa.eu/PECASUS has started 24/7 operations of the space weather services for civil aviation on November 7th 2019.!!http://pecasus.eu/
Slide15Forecasting ionospheric Total Electron Content at global level one day in advance
Cesaroni et al. Space Weather workshops has been proposed: stay tuned!Session G12 Long term ionosphere forecastingconveners: M. Hernandez Pajares, A. Beleaki, L. Spogliluca.spogli@ingv.it RemarksTEC Forecasting (24 Hrs) Model is in place and working in real-timeAt statistical level, model accuracy is 0.1 TECu and precision is 3.5 TECuCapability to model TEC variations during stormsAccuracy 0.4 to 0.9 TECU, precision below 5.1 TECuIndependently on storm intensityPerformance worsens at EIA crestsGood prediction capability over the oceans (Jason3 data)Paper under revision in Journal of Space Weather and Space ClimateThanks!
Slide16Forecasting ionospheric Total Electron Content at global level one day in advance
Cesaroni et al. Backup slides
Slide17Forecasting ionospheric Total Electron Content at global level one day in advance
Cesaroni et al. Model validation: frozen ionosphereFrozen ionosphereModel
Slide18Forecasting ionospheric Total Electron Content at global level one day in advance
Cesaroni et al. Model validation: Jason-3WARNING: JASON-3 vTEC measurement is slightly affected by the missing topside-plasmaspheric component in the altimeter measurements with respect to the GNSS vTECHeight = 1330 km. Coverage over the oceans between latitudes of 66°N and 66°S