/
2016-2017 Budget Adoption (Updated) 2016-2017 Budget Adoption (Updated)

2016-2017 Budget Adoption (Updated) - PowerPoint Presentation

stefany-barnette
stefany-barnette . @stefany-barnette
Follow
402 views
Uploaded On 2017-10-22

2016-2017 Budget Adoption (Updated) - PPT Presentation

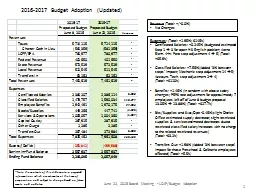
June 22 2016 Board Meeting LCAPBudget Adoption 1 Revenue Total 00 No Changes Expenses Total 195 146k Certificated Salaries 0245 budgeted estimated Step 1 3 ID: 598419

budget 2016 projected adoption 2016 budget adoption projected time amp based updates future estimates change total june preparation contents

Share:

Link:

Embed:

Download Presentation from below link

Download Presentation The PPT/PDF document "2016-2017 Budget Adoption (Updated)" is the property of its rightful owner. Permission is granted to download and print the materials on this web site for personal, non-commercial use only, and to display it on your personal computer provided you do not modify the materials and that you retain all copyright notices contained in the materials. By downloading content from our website, you accept the terms of this agreement.


Presentation Transcript

Slide1

2016-2017 Budget Adoption (Updated)

June 22, 2016 Board Meeting - LCAP/Budget Adoption

1

Revenue (Total: +/-0.0%)No Changes

Expenses: (Total: +1.95%; $146k)Certificated Salaries: +0.245% (budgeted estimated Step 1  3 for open HS English position; Arena Elem. 4-hr. Para step adjustment 4  5) (Total: +$5.9k)Classified Salaries: +7.56% (Added ‘3% between steps’ impact; Mechanic step adjustment 14  5; Account. Tech. step adjustment 2 4) (Total: +$110k)Benefits: +1.46% (in tandem with above salary changes; PERS rate adjustment for approximately 7 employees left off of June 8 budget proposal 13.05%  13.88%) (Total: +$27.7k)Bks/Supplies and Svcs/Ops: -0.46% (slight District Office estimated supply decrease; slight restricted supplies & services estimated decreases due to restricted classified salary increases with no change to the related restricted revenues) (Total: -$3.2k) Transfers Out: +1.98% (Added ‘3% between steps’ impact for those Preschool & Cafeteria employees affected) (Total: +5.5k)

*Note: the contents of this slide contain projected information, which are estimates at the time of preparation and subject to change based on future events and updates.Slide2

Point Arena Schools 2016-17 Budget Adoption

Projected Excess/(Deficit) Controlling for Estimated One-time Revenues & Expenses

2

*Note: the contents of this slide contain projected information, which are estimates at the time of preparation and subject to change based on future events and updates.June 22, 2016 Board Meeting - LCAP/Budget AdoptionSlide3

June 22, 2016 Board Meeting - LCAP/Budget Adoption

3

2016-2017 Budget Adoption & Multi-Year Projections

Multi-Year Assumptions:Taxes: +1% projected increase year-over-year

LCFF/EPA: – FlatFederal: – FlatState: – 16-17: Less One-Time Mandated-related Funds (-$88k); Plus estimated CTEIG grant 50% apportionment (+$52k); 17-18: Less no Prop39 funds estimated (-$86k).Local: - FlatTransfers In: FlatSalaries: + step increase Benefits: in tandem with salary increases plus future STRS & PERS rate increasesBooks/Supplies: 17-18 Plus CTEIG grant $1.5:$1 match (+$55k); 18-19 Plus CTEIG grant $2:$1 match (+$73k).Service/Ops: 17-18 Less decreased NTN fee (-$7.5k); less no budgeted Prop39 consultant fees (-$25k); 18-19 Less decreased NTN fee (-$100.2k); less no budgeted Ed. Effect. Exp.s

(-$15.3k)Capital Outlay: Less reduction in estimated Prop39 related exp.s (-$176k); plus est. AE painting (+$40k)

Transfers Out

: Salary/benefit changes in other funds (

ie

. Preschool & Cafeteria)

*Note: the contents of this slide contain projected information, which are estimates at the time of preparation and subject to change based on future events and updates.

Proposed

Multi-Year

Budget

2016-17

2017-18

2018-19

Taxes

5,714,115

5,771,257

5,828,969

Charter Cash in Lieu

(581,359)

(581,359)

(581,359)

LCFF/EPA

780,977

780,977

780,977

Federal Revenue

401,650

401,650

401,650

State Revenue

572,529

536,767

451,049

Local Revenue

511,545

511,545

511,545

Transfers In

62,162

62,162

62,162

Total Revenues

7,461,619

7,482,998

7,454,993


Expenses


Cert Salaries

2,386,114

2,417,340

2,449,187

Class Salaries

1,590,034

1,626,978

1,662,452

Emp Benefits

1,970,175

2,087,949

2,175,741

Books/Supplies

447,741

502,411

520,635

Services & Ops

1,004,360

971,860

856,384

Capital Outlay

287,915

151,436

-

Other Outgo

2,285

-

-

Transfers Out

272,984

282,569

289,376

Total Expenses

7,961,608

8,040,542

7,953,775


Excess/(Deficit)

(499,988)

(557,544)

(498,783)


Beginning Fund Balance

2,557,937

2,057,949

1,500,405

Ending Fund Balance

2,057,949

1,500,405

1,001,622 Slide4

4

2016-2017Projected Revenues

2016-2017Projected Expenditures

Projected Revenues = $7,461,619Projected Expenditures = $7,961,608

June 22, 2016 Board Meeting – LCAP/Budget Adoption*Note: the contents of this slide contain projected information, which are estimates at the time of preparation and subject to change based on future events and updates.Slide5

June 22, 2016 Board Meeting - LCAP/Budget Adoption

5

2016-17 Budget Adoption Components of Ending Fund Balance

*Note: the contents of this slide contain projected information, which are estimates at the time of preparation and subject to change based on future events and updates.Slide6

6

*Note: the contents of this slide contain projected information, which are estimates at the time of preparation and subject to change based on future events and updates.

June 22, 2016 Board Meeting - LCAP/Budget AdoptionSlide7

Other Considerations

7

June 22, 2016 Board Meeting - LCAP/Budget Adoption

Taxes: Property tax revenues may fluctuate throughout the year – we receive property tax updates from both Mendocino & Sonoma Counties at P1 (Fall), P2 (Spring), and Final (Summer).Timing of Prop 39 funds and expenses will vary due to pending California Department of Education cash allocation timing, as well as prioritization & execution of related projects. Budgeted Prop 39 revenue and expense amounts are based on timing estimates. Some expenses may end up in other categories (

ie. Materials/Supplies, Service & Operations) in addition to the current budgeted categories, Capital Outlay and Service & Operations.Local Revenue: Typically receive higher than budgeted based on unknown one-time donations/funding at budget adoption.*Note: the contents of this slide contain projected information, which are estimates at the time of preparation and subject to change based on future events and updates.Slide8

Prop 39 Funds Summary Assumptions – 2016-17 Budget Adoption

*Note: the contents of this slide contain projected information, which are estimates at the time of preparation and subject to change based on future events and updates.

June 22, 2016 Board Meeting - LCAP/Budget Adoption