/
All amounts in Indian Rupees lakhs, except share data All amounts in Indian Rupees lakhs, except share data

All amounts in Indian Rupees lakhs, except share data - PDF document

stefany-barnette
stefany-barnette . @stefany-barnette
Follow
402 views
Uploaded On 2016-08-17

All amounts in Indian Rupees lakhs, except share data - PPT Presentation

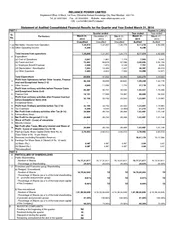
Year ended Sl No Particulars 30092014 30062014 30092013 30092014 30092013 31032014 Unaudited Unaudited Unaudited Unaudited Unaudited Audited 1 Net Income from Sales and Servi ID: 450374

Year ended Sl. No. Particulars 30.09.2014 30.06.2014 30.09.2013 30.09.2014 30.09.2013 31.03.2014 (Unaudited) (Unaudited) (Unaudited) (Unaudited) (Unaudited) (Audited) 1 Net Income from

Share:

Link:

Embed:

Download Presentation from below link

Download Pdf The PPT/PDF document "All amounts in Indian Rupees lakhs, exce..." is the property of its rightful owner. Permission is granted to download and print the materials on this web site for personal, non-commercial use only, and to display it on your personal computer provided you do not modify the materials and that you retain all copyright notices contained in the materials. By downloading content from our website, you accept the terms of this agreement.


Presentation Transcript

All amounts in Indian Rupees lakhs, except share data Year ended Sl. No. Particulars 30.09.2014 30.06.2014 30.09.2013 30.09.2014 30.09.2013 31.03.2014 (Unaudited) (Unaudited) (Unaudited) (Unaudited) (Unaudited) (Audited) 1 Net Income from Sales and Services 358,781 351,754 335,745 710,535 620,237 1,321,703 2 Cost of Sales and Services a) (Increase) / decrease in stock-in-trade and work-in-progress (12,382) (6,930) (10,080) (19,312) (21,955) (33,094) b) Consumption of raw materials 75,626 66,875 77,065 142,501 142,649 273,402 c) Purchase of traded goods 21,258 18,488 15,100 39,746 36,396 76,797 d) Other expenditure 64,419 64,882 58,970 129,301 118,267 246,583 3 Gross Profit (1 - 2) 209,860 208,439 194,689 418,299 344,881 758,015 4 Selling, General and Administrative expenses 106,733 106,789 97,368 213,522 185,304 387,830 5 Research and Development expenses 41,131 38,753 30,087 79,884 54,384 124,023 6 Other (income) / expense, net (2,656) (1,848) (6,367) (4,504) (10,123) (14,159) 7 Operating profit (3) - (4 + 5 + 6) 64,652 64,745 73,601 129,397 115,316 260,321 8 Finance (expense) / income, net 4,211 4,809 2,913 9,020 2,214 3,995 9 Share of profit of equity accounted affiliate, net of income taxes 511 534 437 1,045 792 1,741 10 Profit before tax (7+8+9) 69,374 70,088 76,951 139,462 118,322 266,057 11 Tax expense 11,964 15,049 7,926 27,013 13,204 50,937 12 Net Profit after tax (10-11) 57,410 55,039 69,025 112,449 105,118 215,120 13 Extra-ordinary items (net of tax expense) - - - - - - 14 Net Profit for the period / year (12 - 13) 57,410 55,039 69,025 112,449 105,118 215,120 15 Net profit attributable to: - Equity holders of the Company 57,410 55,039 69,033 112,449 105,132 215,145 - Non-controlling interest - - (8) - (14) (25) 16 Paid-up equity share capital (Face value of Rs. 5/- each) 8,518 8,517 8,505 8,518 8,505 8,505 17 Securities premium, retained earnings, share based payment reserve and other components of equity 899,541 18 Earnings per share before and after extra-ordinary items (in Rupees) per Rs. 5/- share - Basic 33.70 32.34 40.59 66.05 61.85 126.52 - Diluted 33.60 32.24 40.47 65.82 61.62 126.04 (Not annualised) (Not annualised) (Not annualised) (Not annualised) (Not annualised) 19 Public shareholding * - Number of shares 97,914,376 95,472,936 97,979,592 97,914,376 97,979,592 96,048,821 - Percentage of shareholding 57.47 56.05 57.60 57.47 57.60 56.47 20 Promoters and promoter group shareholding a) Pledged / Encumbered - Number of shares - - - - - - - Percentage of shares (as a % of the total shareholding of promoter and promoter group) - - - - - - - Percentage of shares (as a % of the total share capital of the Company) - - - - - - b) Non-encumbered - Number of shares 43,417,812 43,417,812 43,417,812 43,417,812 43,417,812 43,417,812 - Percentage of shares (as a % of the total shareholding of promoter and promoter group) 100.00 100.00 100.00 100.00 100.00 100.00 - Percentage of shares (as a % of the total share capital of the Company) 25.49 25.49 25.53 25.49 25.53 25.52 21 Details of items exceeding 10% of total expenditure - Employee cost 73,113 71,643 60,052 144,756 115,749 249,364 *Public Shareholding as defined under Clause 40A of the Listing Agreement (excludes shares held by Promoters, Promoter Group and American Depository Receipt holders) Unaudited consolidated financial results of Dr. Reddy's Laboratories Limited and its subsidiaries for the quarter and half year ended 30 September 2014 prepared in compliance with International Financial Reporting Standards (IFRS) as issued by the International Accounting Standards Board (IASB) Quarter ended Half year ended All amounts in Indian Rupees lakhs Year ended Sl. No. Particulars 30.09.2014 30.06.2014 30.09.2013 30.09.2014 30.09.2013 31.03.2014 (Unaudited) (Unaudited) (Unaudited) (Unaudited) (Unaudited) (Audited) Segment wise revenue and results: 1 Segment revenue : a) Pharmaceutical Services and Active Ingredients 83,017 73,454 78,324 156,471 147,157 295,750 b) Global Generics 288,680 290,026 265,478 578,706 484,503 1,051,636 c) Proprietary Products 2,978 3,059 4,254 6,037 7,445 17,783 d) Others 3,204 3,293 1,987 6,497 5,581 12,545 Total 377,879 369,832 350,043 747,711 644,686 1,377,714 Less: Inter-segment revenue 19,098 18,078 14,298 37,176 24,449 56,011 Net Revenue from operations 358,781 351,754 335,745 710,535 620,237 1,321,703 2 Segment results : Gross Profit from each segment a) Pharmaceutical Services and Active Ingredients 17,127 12,334 15,774 29,461 26,907 48,476 b) Global Generics 189,273 192,809 175,591 382,082 310,415 691,490 c) Proprietary Products 2,653 2,443 4,057 5,096 6,872 16,062 d) Others 807 853 (733) 1,660 687 1,987 Total 209,860 208,439 194,689 418,299 344,881 758,015 Less: Other un-allocable expenditure, net of other income 140,486 138,351 117,738 278,837 226,559 491,958 Total profit before tax 69,374 70,088 76,951 139,462 118,322 266,057 Segmental Capital employed Notes: 1 Investor Complaints Pending at the beginning of the quarter NIL Received during the quarter 4 Disposed off during the quarter 2 Remaining unresolved at the end of the quarter 2* *Since resolved 2 3 4 5 Segment reporting (Consolidated) Quarter ended Global Generics includes operations of Biologics business. Inter-segment revenue represents sale from Pharmaceutical Services and Active Ingredients to Global Generics at Cost. Half year ended As certain assets of the Company including manufacturing facilities, development facilities and treasury assets and liabilities are often deployed interchangeably across segments, it is impractical to allocate these assets and liabilities to each segment. Hence, the details for capital employed have not been disclosed in the above table. On 18 October 2014, the Company entered into an asset purchase agreement with Novartis Consumer Health Inc. to acquire the title and rights to Habitrol ® franchise (an over-the-counter nicotine replacement therapy transdermal patch) and to market the product in the U.S. territory. The agreement is subject to FTC review and the transfer of asset will happen post FTC clearance. The Securities and Exchange Board of India (SEBI) issued a circular dated 5 April 2010 permitting listed entities having subsidiaries to voluntarily submit the Consolidated Financial Statements as per IFRS. Consequent to this, the Company has voluntarily prepared and published unaudited Consolidated Financial Statements as per IFRS. The unaudited results have been reviewed by the Audit Committee of the Board on 28 October 2014 and approved by the Board of Directors of the Company at their meeting held on 29 October 2014. The above financial results have been prepared from the consolidated financial statements, which are prepared in accordance with International Financial Reporting Standards and its interpretations (IFRS), as issued by the International Accounting Standards Board (IASB). The results for the quarter and half year ended 30 September 2014 have been subjected to a "Limited Review" by the Statutory Auditors of the Company. An unqualified report has been issued by them thereon. 6 Statement of Assets and Liabilities (Consolidated) All amounts in Indian Rupees lakhs As at As at 30.09.2014 31.03.2014 (Unaudited) (Audited) ASSETS Current assets Cash and cash equivalents 82,164 84,510 Other investments 205,205 250,828 Trade and other receivables 377,222 330,365 Inventories 281,231 239,923 Derivative financial instruments 4,420 5,535 Current tax assets 5,093 12,978 Other current assets 118,415 113,330 Total current assets 1,073,750 1,037,469 Non-current assets Property, plant and equipment 465,593 444,235 Goodwill 35,534 34,284 Other intangible assets 100,947 112,687 Investment in equity accounted investees 9,423 8,062 Other investments – non-current 114 1 Deferred tax assets 69,641 60,536 Other non-current assets 8,177 4,954 Total non-current assets 689,429 664,759 Total assets 1,763,179 1,702,228 LIABILITIES AND EQUITY Current liabilities Trade and other payables 128,433 105,028 Derivative financial instruments 3,866 3,055 Current tax liabilities 17,784 11,925 Short-term borrowings 140,515 206,065 Long-term borrowings, current portion 69,163 33,954 Provisions 31,701 28,192 Other current liabilities 155,863 152,412 Total current liabilities 547,325 540,631 Non-current liabilities Long-term loans and borrowings, excluding current portion 178,864 207,396 Provisions - non-current 577 921 Deferred tax liabilities 28,719 27,437 Other non-current liabilities 17,654 17,842 Total non-current liabilities 225,814 253,596 Total liabilities 773,139 794,227 Equity Share capital 8,518 8,505 Equity shares held by controlled trust - (49) Share premium 221,604 215,523 Share based payment reserve 8,264 10,075 Retained earnings 727,087 650,500 Other components of equity 24,567 23,447 Total equity 990,040 908,001 Total liabilities and equity 1,763,179 1,702,228 7 All amounts in Indian Rupees lakhs Year ended Particulars 30.09.2014 30.06.2014 30.09.2013 30.09.2014 30.09.2013 31.03.2014 (Unaudited) (Unaudited) (Unaudited) (Unaudited) (Unaudited) (Audited) Total income from operations 248,084 269,048 270,754 517,132 452,916 972,805 Profit from ordinary activities before tax 51,522 78,168 91,476 129,690 99,812 245,439 Profit from ordinary activities after tax 43,359 60,275 77,338 103,634 83,824 193,284        By order of the Board For Dr. Reddy's Laboratories Limited Place: Hyderabad                                                                           G V Prasad Date: 29 October 2014 Half year ended Co-Chairman & Chief Executive Officer Note: The unaudited standalone financial results for the quarter and half year ended 30 September 2014 are available on the Stock Exchange's website : www.bseindia.com and www.nseindia.com and also on the Company's website: www.drreddys.com. Unaudited financial results of Dr. Reddy's Laboratories Limited (Standalone Information) prepared as per IGAAP Quarter ended Particulars