/
BOWHUNTER OBSERVATIONS VERSUS SPOTLIGHTING AS AN INDEX TO DEER ABUNDAN BOWHUNTER OBSERVATIONS VERSUS SPOTLIGHTING AS AN INDEX TO DEER ABUNDAN

BOWHUNTER OBSERVATIONS VERSUS SPOTLIGHTING AS AN INDEX TO DEER ABUNDAN - PDF document

stefany-barnette
stefany-barnette . @stefany-barnette
Follow
383 views
Uploaded On 2016-08-06

BOWHUNTER OBSERVATIONS VERSUS SPOTLIGHTING AS AN INDEX TO DEER ABUNDAN - PPT Presentation

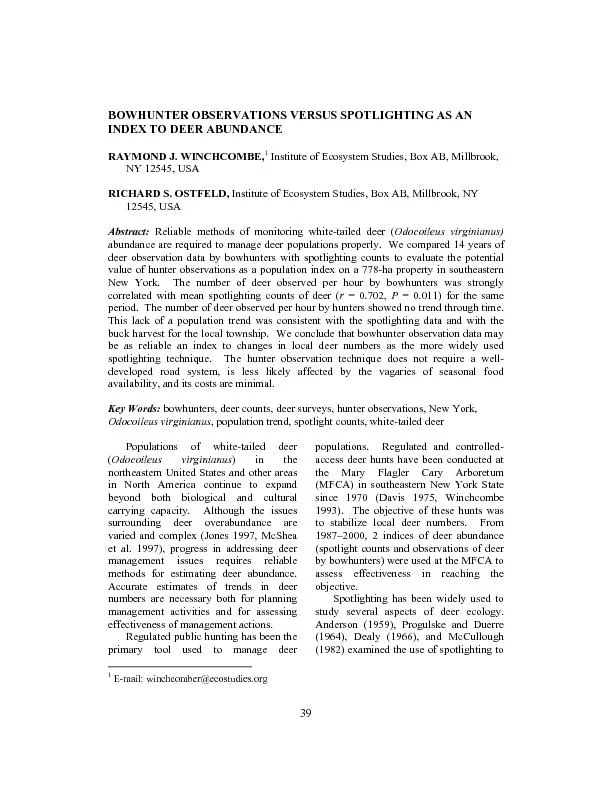
Email winchcomberecostudiesorg Populations of whitetailed deer Odocoileus virginianusin the northeastern United States and other areas in North America continue to expand beyond both biological ID: 434981

E-mail: winchcomber@ecostudies.org Populations

Share:

Link:

Embed:

Download Presentation from below link

Download Pdf The PPT/PDF document "BOWHUNTER OBSERVATIONS VERSUS SPOTLIGHTI..." is the property of its rightful owner. Permission is granted to download and print the materials on this web site for personal, non-commercial use only, and to display it on your personal computer provided you do not modify the materials and that you retain all copyright notices contained in the materials. By downloading content from our website, you accept the terms of this agreement.


Presentation Transcript

BOWHUNTER OBSERVATIONS VERSUS SPOTLIGHTING AS AN INDEX TO DEER ABUNDANCERAYMOND J. WINCHCOMBE, Institute of Ecosystem Studies, Box AB, Millbrook, NY 12545, USA RICHARD S. OSTFELD, Institute of Ecosystem Studies, Box AB, Millbrook, NY 12545, USAReliable methods of monitoring white-tailed deer (Odocoileus virginianus) abundance are required to manage deer populations properly. We compared 14 years of deer observation data by bowhunters with spotlighting counts to evaluate the potential value of hunter observations as a population index on a 778-ha property in southeastern New York. The number of deer observed per hour by bowhunters was strongly correlated with mean spotlighting counts of deer ( = 0.702, = 0.011) for the same period. The number of deer observed per hour by hunters showed no trend through time. This lack of a population trend was consistent with the spotlighting data and with the buck harvest for the local township. We conclude that bowhunter observation data may be as reliable an index to changes in local deer numbers as the more widely used spotlighting technique. The hunter observation technique does not require a well-developed road system, is less likely affected by the vagaries of seasonal food availability, and its costs are minimal. bowhunters, deer counts, deer surveys, hunter observations, New York, , population trend, spotlight E-mail: winchcomber@ecostudies.org Populations of white-tailed deer Odocoileus virginianusin the northeastern United States and other areas in North America continue to expand beyond both biological and cultural carrying capacity. Although the issues surrounding deer overabundance are varied and complex (Jones 1997, McShea et al. 1997), progress in addressing deer management issues requires reliable methods for estimating deer abundance. Accurate estimates of trends in deer numbers are necessary both for planning management activities and for assessing effectiveness of management actions. Regulated public hunting has been the primary tool used to manage deer populations. Regulated and controlled- access deer hunts have been conducted at the Mary Flagler Cary Arboretum (MFCA) in southeastern New York State since 1970 (Davis 1975, Winchcombe 1993). The objective of these hunts was to stabilize local deer numbers. From 1987–2000, 2 indices of deer abundance (spotlight counts and observations of deer by bowhunters) were used at the MFCA to assess effectiveness in reaching the Spotlighting has been widely used to study several aspects of deer ecology. Anderson (1959), Progulske and Duerre (1964), Dealy (1966), and McCullough (1982) examined the use of spotlighting to Northeast Wildlife Vol. 56, 2001 determine deer population trends, and in some cases, habitat use, herd composition, and productivity. Standardized techniques with repetitive samples over fixed routes reduce biases that can result from variation in factors such as season (McCullough 1982), time of day (Progulske and Duerre 1964), weather (Dealy 1966), habitat type (Anderson 1959), behavior (Beier and McCullough 1990), and food availability (McShea and Schwede 1993). Several studies (e.g., Progulske and Duerre 1964, Carbaugh et al. 1975, McCullough 1982, McShea and Schwede 1993) have reported that the year-to-year variation in availability and distribution of preferred foods influences movements of deer, which may in turn affect their accessibility to spotlighters. For example, female deer in Virginia shifted their home ranges to incorporate acorn-producing areas during mast-fall Using hunter observations as a technique to measure trends in a local deer population has not been widely reported. Zagata and Haugen (1974) used observations by bowhunters at dawn and dusk to examine the effects of weather on counts of white-tailed deer in Iowa. Downing et al. (1965) compared 5 census techniques (pellet group counts, track counts, drive censuses, strip counts, and hunter observations) in an enclosure with a known deer population in Georgia. They concluded that hunter observations could provide an accurate index of trends in deer abundance. Holsworth (1973) had a small group of hunters record effort and deer seen while reducing a population of white-tailed deer on Griffith Island, Ontario. He developed an index of hunter efficiency but could not predict population density. Lancia et al. (1996) used data from hunters’ diaries to develop a joint sight-and-kill catch per unit effort model to estimate number of antlered bucks on Chesapeake Farms in Maryland. They concluded that data necessary for the model (effort and catch) could be easily obtained from hunters without additional fieldwork by managers. Our main objective in this study was to monitor long-term trends in deer abundance by spotlighif data from bowhunter observations for the same period were comparable to the more costly and labor-intensive spotlighting counts. Secondarily, we compared both our spotlighting and bowhunter counts with the buck harvest within the township to assess correspondence with an independent measure of deer population change. STUDY AREA The MFCA (778 ha) is located in central Dutchess County, New York and is owned by the Institute of Ecosystem Studies (IES). The IES supports diverse programs of ecological research and education, and a horticultural program. The area can be characterized as a post-agricultural landscape, about 50% upland hardwood and mixed hardwood–conifer forests, 28% open fields and meadows, 20% overgrown old fields, and 2% swamp-marsh habitats. Glitzenstein et al. (1990) provided specific descriptions of forest species, climate, topography, soils, and local agricultural history. An extensive private road system in conjunction with public roads provided vehicle access to all fields used in this study. The landscape surrounding the MFCA ped woodlands, hayfields, some residential housing (minimum sized parcels of 2–5 ha), a Hunter observations vs. spotlighting · Winchcombe and Ostfeld large cattle and horse farm, and a commercial bird-shooting preserve. Deer hunting on some of these properties varied from being prohibited or severely restricted to more liberal hunting access. The entire area is part of Wildlife Management Unit 3G of the New York State Department of Environmental Conservation (NYDEC). For the past 24 years, a strong emphasis has been placed on the removal of adult females from the MFCA during annual controlled-access hunts in order to stabilize the deer population and reduce negative impacts on forested systems, ecological research efforts, and horticultural display areas. METHODS We analyzed the results of fall spotlighting counts of deer on the MFCA from 1987–2000. On average, 7 trips per year were taken between late September and mid-November. Two trips per week were scheduled with at least 2 days between trips. We used a 4-wheel-drive pickup truck equipped with 2 hand-held spotlights (300,000–400,000 candle power), which ran off the electrical system of the truck, to locate deer in fields along the spotlighting route. Spotlighting began 1 hour after sunset and continued until the 19.7-km route was completed (average time 2.5 hours). This time of day has been reported to be the period of highest deer activity (Anderson 1959, Progulske and Duerre 1964). Most fields spotlighted were on the MFCA, although some were on adjoining lands. We spotlighted about 10% (81 hectares) of the MFCA (calculated from 1:3600 maps). All fields on the spotlighting route were mowed or hayed by late August and either had adequate perimeter road access or were accessible by our vehicle. The spotlighting crew consisted of a driver and a data recorder in the cab, 2 spotlight operator–spotters and the primary deer identifier on a bench seat behind the cab, and 1–4 additional spotter–identifiers in the bed of the truck behind the bench seat. Spotter–identifiers used binoculars (750 mm) to identify deer. Over this 14-year period, 2 individuals did most of the driving. While spotlighting, vehicle speed was 15–20 km/hr on roads and slower off-road. When deer were sighted, we signaled the driver to either drive towards the deer or stop. We conducted a complete search of the area and counted all deer seen. We then approached the deer using as little light as possible and identified all animals as either antlered bucks, does (yearlings or adults), fawns, or unknowns. The primary spotter made the final decision on all identifications. We were cautious not to double-count any deer that might have moved through hedgerows of adjacent fields. We conducted no spotlighting in heavy rain or We generated an annual mean number of deer counted per spotlighting trip by averaging data collected for all trips in a given year. Untransformed values were used for correlating the spotlighting and bowhunter observation data. To determine trends in deer numbers over the course of the study, spotlighting counts were log-transformed to stabilize the variance and regressed against year. A prior analysis of the coefficient of variation (CV) in spotlighting counts over all trips within each year (average CV = 18.1%) suggested high precision of the spotlighting data (Winchcombe and Ostfeld 2001). Northeast Wildlife Vol. 56, 2001 We used the residuals of the spotlighting regression to test the hypothesis that in years of increased acorn production, observations of deer during spotlighting counts would decrease because acorns would attract deer to oak forests (McShea and Schwede 1993). Acorn production was estimated using 20 seed traps on each of two long-term forest monitoring sites on the grounds of MFCA. Seed traps (see Ostfeld et al. [1998] for details) were placed under the canopies of mature trees in August or September of each year and mature acorns were counted every 3–4 weeks through December 31st (1995–2000). We used 0.05 as the significance level in all analyses. A limited-access bowhunting program has been in place on the MFCA for 25 years. Data on deer observed while hunting were recorded for the 1987–2000 bow hunting seasons. During this study, 25 different hunters participated in the program, with an average of 9 (range 7–11) hunters per year. The mean number of hours hunted per year for all hunters during the 1987–2000 period was 40 hours (range of means = 29–54 hours). Individual hunter effort varied among years and ranged from a low of 8 hours to a high of 94 hours for all hunters during this period. The archery season during these years began on October 15 and ended in mid-November. Hunters were IES staff members or volunteers working with the staff wildlife biologist. After passing a shooting proficiency test and attending a brief orientation meeting, bowhunters were given exclusive access to a specified area of the property. No attempt was made to classify hunters into categories reflecting hunter experience but all hunters had at least 3 years bowhunting experience. Thirty-four discrete hunting areas averaging 22 ha in size (range 9.3–35.7 ha) were available. Almost all hunting took place from tree stands, and bowhunters were most active during the first 2 hours and the last 2 hours of daylight. Movements on the ground by the bowhunters were primarily for entering and leaving the area and for scouting new stand locations. A small amount of still-hunting was conducted associated with scouting the area. Hunters recorded deer observations on a data card for each hunting trip. Data included date hunted, number of hours hunted, and number of bucks, does, fawns and unknown deer observed while hunting. Most observations were made when hunters were in tree stands. We summarized hunter effort, number of deer seen, and the age and sex of deer observed by year. The number of deer observed per hour of hunting was examined for correlation with spotlighting counts and for trends through time. Township Buck Harvest As an independent measure of change in local deer abundance, we examined the buck harvest of the surrounding township (Town of Washington, Dutchess County, ) for 1987–2000. Harvest data were obtained from public reports compiled by the NYDEC, Division of Fish and Wildlife. The NYDEC has long used changes in the buck harvest as an index to change in deer abundance and for setting harvest quotas of antlerless deer (Dickinson 1982). Similarly, Underwood and Porter (1997) associated increases in the buck harvest of Stillwater Township, New York, with the burgeoning Hunter observations vs. spotlighting · Winchcombe and Ostfeld population of deer at Saratoga National Historical Park, Saratoga County, New Spotlighting counts did not detect a significant change in deer abundance at the MFCA between 1987 and 2000. A regression of average annual spotlighting transformed) against year showed no significant trend (= 0.20, df = 0.12; Fig. 1). In this analysis we excluded the 1999 data because that year was a statistical outlier (Studentized residual = 2.58). The average count in 1999 was 168 deer, which was 42% higher than the previous 5-year average of 97. A regression of the average number of deer counted per hour of hunter transformed) against year showed no significant change (0.004, df = 12, = 0.85; Fig. 1). In this analysis we excluded the 1987 bowhunter data because that year was a statistical outlier (Studentized residual = -3.76). Hunter effort in 1987 was 44% lower than the average of all years (= 366 hours, range = 248–536). Buck harvest data for the Town of Washington (1987–2000) were examined for trends. A regression of the buck harvest (log transformed) against year showed no significant change ( = 0.17, df = 13, = 0.14; Fig. 1) during this period. During the years of this study, the MFCA had an average annual harvest of 72 deer (9.2 deer/km including 3.6 ), with an adult sex ratio in the harvest of 0.9 females to 1.0 males. There was a non-significant negative = 0.42, df = 5, = 0.08) between the residual value for spotlighting counts for each year and the index of acorn production for that year. We found no evidence of a relationship between residuals of bowhunter counts and the = 0.09, df = 5, The number of deer observed by bow hunters per hour of observation (= 0.73, SE = 0.05) was significantly correlated with the mean number of deer observed spotlighting ( = 0.70, df = 11, = 0.01, Fig. 2). We found a stronger correlation when using data from only those hunters = 3) who participated during all years of the study ( = 0.001). Fig. 1. Metrics of white-tailed deer abundance, 1987-2000. ) Average number seen per spotlighting trip at the Mary Flagler Cary Arboretum (MFCA) (1999 data removed as statistical outlier), ) Average number of deer seen per hour by bowhunters at the MFCA (1987 data removed as statistical outlier), ) Total buck harvest for the Town of Washington. Northeast Wildlife Vol. 56, 2001 Fig. 2. Correlation between the annual values for average number of deer seen per spotlighting trip and number of deer observed per hour by bowhunters. Data cover the period 1987–2000 (1987 and 1999 data excluded from analysis as statistical outliers). DISCUSSION Reliable methods for estimating deer abundance are vital for directing and assessing management decisions. Determining the most appropriate methods is often a matter of scale. For statewide programs with large deer management units, trends in deer numbers can often be discerned from buck harvest data (Dickinson 1982, Underwood and Porter 1997). Additional insight may be gained from changes in agricultural damage complaints and deer–vehicle collisions. For example, the number of road-killed deer provided a useful index to changes in deer populations in Wisconsin (McCaffrey 1973). However, for smaller, more discrete parcels of land, crop damage and accident information are either not available, inconclusive, or not relevant. In addition, the lack of significant variability in hunter numbers, hunter effort, and deer harvested in these smaller programs makes it difficult to detect trends. For these smaller sites, techniques such as spotlighting (when conditions permit) or hunter observations may provide managers with an index to changes in deer Spotlighting has long been used as a technique for assessing trends in abundance of white-tailed deer (Anderson 1959, Progulske and Duerre 1964, Dealy 1966, McCullough 1982). Our study site had a network of public and private roads that provided excellent access to all fields. We searched only open areas and immediate road edges where the probability of counting all deer present was high. Both Anderson (1959) and Storm et al. (1992) reported that observers found 95% of eye reflectors and deer silhouettes placed in open areas when testing for detection rates in different habitats. The primary spotlighting crew was the driver, the 2 spotlight operators, and the deer identifier. The 2 spotlighters and the deer identifier worked in unison to find all deer along the route. The deer identifier and other spotter–identifiers present worked together to actually identify individual deer. We used all possible means of reducing bias owing to over or under counting among years. As a result, and because the average CV of all 14 years was low (18.1%), we conclude that our estimation of population trend was sufficiently robust (Harris 1986), and that our spotlighting effort provided a consistent means of indexing deer abundance at our site. The 1999 spotlighting data were identified as a statistical outlier. With an average count 42% higher than the average of the previous 5 years, these data were not used in analyzing spotlighting trends or in calculating the correlation with hunter observation data. We believe unusual Hunter observations vs. spotlighting · Winchcombe and Ostfeld environmental conditions, specifically a severe late spring and summer drought, were responsible for an inflated count that year. Drought conditions left the forest understory dry, withered, and with little mast. Late-summer and early-fall rains provided a flush of new palatable herbaceous growth in our fields. Deer concentrated on this food source and were highly visible in fields both day and night throughout the fall. Many factors can influence spotlight counts (e.g., season, diel period, various weather parameters; Anderson 1959, Progulske and Duerre 1964, Dealy 1966, Carbaugh et al 1975, Fafarman and DeYoung 1986, Beier and McCullough 1990). Specifically, Harlow et al. (1975), McCullough (1985), and Pekins and Mautz (1987) reported that acorns comprise a substantial portion of the autumn diet in years of good mast production. Although in our study the regression based on only 6 years of data = 0.08), our analysis of the residuals of the regression of deer counted across years suggested that the presence of a good acorn crop might cause our spotlighting technique to underestimate deer abundance. This would probably occur as a result of acorns attracting deer to oak forest sites where Using hunters to collect information on deer numbers has not been widely reported. Zagata and Haugen (1974) used observations from 18 bowhunters to study the influence of light intensity and various weather phenomena on movements of white-tailed deer at dawn and dusk but made no attempt to determine population trends or deer density from these data. Downing et al. (1965) used gun-hunter observations to detect change in deer abundance in an enclosure where deer population demographics were known. They concluded that hunter observations are an accurate density index if the same area is compared each year. The correlation we observed between the number of deer observed per hour by hunters and the number of deer counted per spotlighting trip (Fig. 2) suggests that these 2 techniques provide similar information on deer abundance and trends through time. Using hunters already in the field would be more cost effective than paying staff to spotlight, and it would address the problem of indexing deer numbers in areas where unimproved roads or trails would preclude the use of spotlighting but not impede access by hunters. Counts of deer by hunter observation are less likely to be affected by movements of deer to cyclically available food resources since hunters can easily adjust their activities to these conditions. This is borne out by the lack of relationship we reported between bowhunter counts of deer and the acorn Downing et al. (1965) used hunters to collect data on deer numbers and showed that 5 samples of 48 hunter-days would be sufficient to detect a 20% change in the population they studied, 95% of the time. Robinson et al. (2000) analyzed observer effect in surveys of bobwhite quail Colinus virginianus) in Kansas and concluded that their index might not accurately reflect population trends if the number of observers changed over time. During the course of this study, the number of observers participating changed little (range 7–11), although in some cases the specific individuals participating changed. Despite these changes, the Northeast Wildlife Vol. 56, 2001 correlation with spotlight counts was still significant. The strength of this relationship increased when using data collected by only those individuals who participated in every year of the study, despite the small sample size ( = 3). This may indicate that on some properties, even a few hunters can provide useful data reflecting actual changes in deer Analysis of the MFCA spotlighting and hunter observation data indicated that deer numbers did not monotonically grow or decline over the 14-year study period. However, the population appeared to fluctuate between years, and therefore we suggest any management decisions be based on the most recent years of data rather than a longer-term average. The similarity between these analyses and the independently generated buck kill data for the surrounding township increases our confidence that both our spotlighting and hunter observation indices reflect larger-scale trends in deer abundance. MANAGEMENT IMPLICATIONS Reliable population indices are essential for assessment of management actions. Our data support the conclusions of others (Progulske and Duerre 1964, Dealy 1966, Gunson 1979, McCullough 1982) that spotlight counts, when applied properly, serve as a reliable population trend index for white-tailed deer. We believe that observations by bowhunters can also be a reliable index. Hunter observation data should be easy and inexpensive to obtain. Areas with poorly developed roads could be surveyed and this activity would allow hunters to participate in scientific as well as management efforts. The increased amount of site-specific information could supplement similar efforts initiated by state wildlife agencies such as that described by Kautz and Kautz (2001) in ACKNOWLEDGMENTS We thank all the various members of the spotlighting crew especially J. DiMetro and J. Dorney, our drivers; D. DiMetro, B. Fanelli, M. Schroeder Sr. and R. Tierney, who handled the spotlights; F. Gerth and F. Welsh, our data recorders, and M. Fargione and D. Wohlbach for their continued participation over the years. We thank S. Bialousz for preparing our vehicle for spotlighting, and adjoining neighbors J. Olson, C. Smith, H. Croner, H. Kelly and T. Bucklin for allowing us to spotlight their land. Bowhunter observation data could not have been collected without the cooperation and effort of those individuals who meticulously recorded data for so many years. We also thank C. Canham, IES staff scientist, for providing the acorn mast data, and F. Keesing for her intellectual input and statistical advice. We are most grateful to M. Ellingwood and H. Kilpatrick for their review and critical comments on an earlier draft of the manuscript. This publication is a contribution to the program of the Institute of Ecosystem Studies. Anderson, C. F., Jr. 1959. Nocturnal activities of the Columbian black-tailed deer, Odocoileus hemionus columbianus Richardson, affecting spotlight census results in the Oregon coast range. Thesis, Oregon State University, Corvallis, Oregon, USA. Beier, P., and D. R. McCullough. 1990. Factors influencing white-tailed deer Hunter observations vs. spotlighting · Winchcombe and Ostfeld activity patterns and habitat use. Wildlife Monographs 109. Carbaugh, B., J. P. Vaughan, E. D. Bellis, and H. B. Graves. 1975. Distribution and activity of white-tailed deer along an interstate highway. Journal of Wildlife Management 39:570-581. Davis, J. A. 1975. Analysis of the first deer harvest on the Cary Estate, Dutchess County, New York. New York Fish and Game Journal 22:128-147. Dealy, J. E. 1966. Spotlighting deer: potentials for management in western Oregon. United States Forest Service, Pacific Northwest Forest and Range Experiment Station Research Note 32. Dickinson, N. R. 1982. Basis for using selected sex ratios in the harvest for deriving quotas for harvesting antlerless deer. New York Fish and Game Journal 29: 75-89. Downing, R. L., W. H. Moore, and J. Kight. 1965. Comparison of deer census techniques applied to a known population in a Georgia enclosure. Proceedings of the Annual Meeting of Southeastern Game and Fish Commissioners 19:26-30. Fafarman, K. R., and C. A. DeYoung. 1986. Evaluation of spotlight counts of deer in south Texas. Wildlife Society Bulletin 14:180-185. Glitzenstein, J. S., C. D. Canham, M. J. McDonnell, and D. R. Streng. 1990. Effects of environment and land-use history on upland forests of the Cary Arboretum, Hudson Valley, New York. Bulletin of the Torrey Botanical Club. 117:106-122. Gunson, J. R. 1979. Use of night-lighted census in management of deer in Alberta and Saskatchewan. Wildlife Society Bulletin 7:259-267. Harlow, R. F., J. B. Whelan, H. S. Crawford, and J. E. Skeen. 1975. Deer foods during years of oak mast abundance and scarcity. Journal of Wildlife Management 39:330-336. Harris, R. B. 1986. Reliability of trend lines obtained from variable counts. Journal of Wildlife Management 50:165-171. Holsworth, W. N. 1973. Hunting efficiency and white-tailed deer density. Journal of Wildlife Management 37:336-342. Jones, E. J., editor. 1997. Wildlife Society Bulletin, Volume 25, Number 2. Special issue–Deer overabundance. The Wildlife Society, Bethesda, Maryland, USA. Kautz, J. E., and M. A. Kautz. 2001. Bowhunter sighting logs to index deer, turkey, and furbearer population size in New York State. Transactions of the Northeast Fish and Wildlife Conference 57:21. Lancia, R. A., J. W. Bishir, M. C. Conner, and C. S. Rosenberry. 1996. Use of catch-effort to estimate population size. Wildlife Society Bulletin 24:731-737. McCaffrey, K. R. 1973. Road-kills show trends in Wisconsin deer populations. Journal of Wildlife Management 37:212-216. McCullough, D. R. 1982. Evaluation of night spotlighting as a deer study technique. Journal of Wildlife Management 46:963-973. _____. 1985. Variables influencing food habits of white-tailed deer on the George Reserve. Journal of Mammalogy 66:682-692. McShea, W. J., and G. Schwede. 1993. Variable acorn crops: responses of white-tailed deer and other mast consumers. Journal of Mammalogy 74:999-1006. _____, H. B. Underwood, and J. H. Rappole, editors. 1997. The science of overabundance: deer ecology and population management. Smithsonian Institution Press, Washington, D. C. USA. Ostfeld, R. S., F. Keesing, C. G. Jones, C. D. Canham, and G. M. Lovett. 1998. Integrative ecology and the dynamics of species in oak forests. Integrative Biology 1:178-186. Pekins, P. J., and W. W. Mautz. 1987. Acorn usage by deer: significance of oak management. Northern Journal of Applied Forestry 4:124-128. Progulske, D. R., and D. C. Duerre. 1964. Factors influencing spotlight counts of Northeast Wildlife Vol. 56, 2001 deer. Journal of Wildlife Management 28:27-34. Robinson, Jr., D. A., W. E. Jensen, and R. D. Applegate. 2000. Observer effect on a rural mail carrier survey population index. Wildlife Society Bulletin 28:330-332. Storm, G. L., D. F. Cottam, R. H. Yahner, and J. D. Nichols. 1992. A comparison of 2 techniques for estimating deer density. Wildlife Society Bulletin 20:197-203. Underwood, H. B., and W. F. Porter. 1997. Reconsidering paradigms of over-population in ungulates: white-tailed deer at Saratoga National Historical Park. Pages 185-198 W. J. McShea, H. B. Underwood, and J. H. Rappole, editors. The science of overabundance: deer ecology and population management. Smithsonian Institution Press, Washington D. C., USA. Winchcombe, R. J. 1993. Controlled access hunting for deer population management: a case study. Northeast Wildlife 50:1-9. _____, and R. S. Ostfeld. 2001. Indexing deer numbers with spotlighting: a long-term study of a managed deer population. Northeast Wildlife 56:31-38. Zagata, M. D., and A. O. Haugen. 1974. Influence of light and weather on observability of Iowa deer. Journal of Wildlife Management 38:220-228.