PPT-Chore Chart
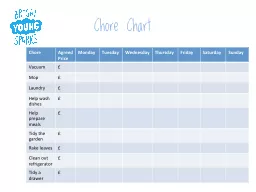
Chore Agreed Price Monday Tuesday Wednesday Thursday Friday Saturday Sunday Vacuum Mop Laundry Help wash dishes Help prepare meals Tidy the garden
Download Presentation
"Chore Chart" is the property of its rightful owner. Permission is granted to download and print materials on this website for personal, non-commercial use only, provided you retain all copyright notices. By downloading content from our website, you accept the terms of this agreement.
Presentation Transcript
Transcript not available.