/
ELECTROMUSCULAR INCAPACIHongyu Sun*, Jiun-Yan Wu*, Rami Abdallah**, an ELECTROMUSCULAR INCAPACIHongyu Sun*, Jiun-Yan Wu*, Rami Abdallah**, an

ELECTROMUSCULAR INCAPACIHongyu Sun*, Jiun-Yan Wu*, Rami Abdallah**, an - PDF document

stefany-barnette
stefany-barnette . @stefany-barnette
Follow
386 views
Uploaded On 2015-08-12

ELECTROMUSCULAR INCAPACIHongyu Sun*, Jiun-Yan Wu*, Rami Abdallah**, an - PPT Presentation

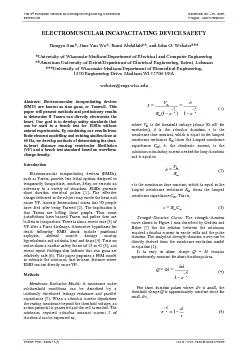
3 Strength150Duration Curve The strength150duration curve shown in Figure 1 was described by Geddes and Baker 7 for the relation between the minimum required stimulus current to excite cell ID: 106136

(3) Strength–Duration Curve: The strength–duration

Share:

Link:

Embed:

Download Presentation from below link

Download Pdf The PPT/PDF document "ELECTROMUSCULAR INCAPACIHongyu Sun*, Jiu..." is the property of its rightful owner. Permission is granted to download and print the materials on this web site for personal, non-commercial use only, and to display it on your personal computer provided you do not modify the materials and that you retain all copyright notices contained in the materials. By downloading content from our website, you accept the terms of this agreement.


Presentation Transcript

ELECTROMUSCULAR INCAPACIHongyu Sun*, Jiun-Yan Wu*, Rami Abdallah**, and John G. Webster*** *University of Wisconsin-Madison/Departmenmputer Engineering **American University of Beirut/Department of Electrical Engin***University of Wisconsin-Madison/Department of Biomedical Engineering, 1550 Engineering Drive, Madison WI 53706 USA Abstract: Electromuscular incapacitating devices (EMD) are known as stun guns, or Tasers®. This paper will present methods and preliminary results to determine if Tasers can directly electrocute the (3) Strength–Duration Curve: The strength–duration curve shown in Figure 1 was described by Geddes and Baker [7] for the relation between the minimum required stimulus current to excite cells and the pulse duration. The analytical strength–duration curve can be directly derived from the membrane excitation model in equation (1). It is easy to show charge remains approximately constant for short duration pulses. d (5) Figure 3: Ventricular and Excitation Thresholds for Different Stimulus Duration Taser waveforms: EMDs generate voltages of about 50 kV, currents of about 2 to 15 A, pulse durations of about 10 to 80 s, repetition rates of about 20 pulses/s, for about 5 s [1]. Figure 4 shows measured waveforms for one pulse of the X26 and M26 Taser. At these short duration pulses, the maximum depolarization voltage depends only on the amount of charge delivered across the capacitor. As an example, for the M26, it is the charge delivered during the first half period (7.8 s) that determines the fibrillating threshold and for the X26 it is the charge delivered during the first 164 Figure 4 shows the M26 and the X26 waveforms for a typical load of 300 . By integrating the current waveforms, we can obtain the maximum charge delivered by the X26 which is 130 C at 164 s and by the M26 which is 103 C at 7.8 020406080100Time (µs) -8-4048121 6 Current (A) X26M26Figure 4: Taser Waveforms Measured at a 300 Load Typical of the Body These observations can be further verified by applying the Taser waveforms to a parallel model. Assuming that 20 mV can excite the cell [7], we can use equation (2) with the previously found rheobasic current density of 70 µA/mm to yield = 286 Knowing that the time constant for fibrillation is 1.7 ms yields F. Figure 5 shows that the maximum voltage is attained at 7.5 s for the M26 and at 127 050100150200250Duration ( -50510152 5 Voltage (mV) X26Figure 5: Simulated Membrane Depolarization Behavior for the X26 and M26 Tasers Predicting the VF Threshold for EMD: To find the VF threshold for EMDs we need to approximate the minimum fibrillating charge density denoted as which approaches a constant value for typical EMD durations. Including the area factor, we can use equation (6) to relate the charge density to the rheobasic current density which we found earlier to yield bJD (8) Although EMD stimuli are applied for 2 to 5 s, they cannot be considered as repetitive stimuli since the current impulses are delivered at very low duty cycle (less than 0.003 [11]) so that effect of each pulse is isolated from the others. Studies have shown that for duty cycle less than 0.1, the effect of prolonged stimulation no longer decreases VF threshold [12]. Therefore, for EMD thresholds we can use the rheobasic current density found above for a single stimulus which is 70 µA/mm. Substituting into equation (8) with equals 1.7 ms yields a minimum fibrillating charge density for EMD of 119 nC/mmFigure 6 shows the variation of charge and current density with respect to stimulus duration for VF thresholds. It shows that charge density, unlike current ventricular fibrillation', Cardiovascular Research Center Bulletin, pp 101-112. [10] RZ. (1980): “Summary of cardiac fibrillation thresholds for 60 Hz currents and voltages applied directly to the heart,” Med. & Biol. Eng. & Comput., pp. 657-659 [11] Taser M26 and X26 manuals. http://www.taser.com/index.htm [12] IEC (1987): 'Effects of current passing through the human body IEC 479-2, 2nd ed.', (International Electrotechnical Commission, Geneva) [13] HAEMMERICHS.,M.,G. (2003): ‘Hepatic Radiofrequency Ablation With Internally Cooled Probes: Effect of Coolant Temperature on Lesion Size’, Biomed. Eng., pp. 493-500 [14] The Zubal Phantom, http://noodle.med.yale.edu/zubal/ [15] NIH/NCRR Dataset Archive, http://www.sci.utah.edu/ncrr/software/login_datasets.html [16] The National Library of Medicine's Visible Human Project, http://www.nlm.nih.gov/research/visible/visible_ human.html