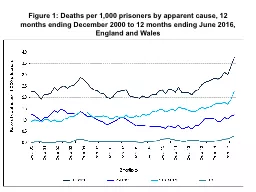
PPT-Figure 1: Deaths per 1,000 prisoners by apparent cause, 12
Author : stefany-barnette | Published Date : 2017-12-06
Age at death by cause 20145 Conclusions PPO reports raise the health issues but it is the courts that determine the size and structure of the prison population Health
Presentation Embed Code
Download Presentation
Download Presentation The PPT/PDF document "Figure 1: Deaths per 1,000 prisoners by ..." is the property of its rightful owner. Permission is granted to download and print the materials on this website for personal, non-commercial use only, and to display it on your personal computer provided you do not modify the materials and that you retain all copyright notices contained in the materials. By downloading content from our website, you accept the terms of this agreement.
Figure 1: Deaths per 1,000 prisoners by apparent cause, 12: Transcript
Download Rules Of Document
"Figure 1: Deaths per 1,000 prisoners by apparent cause, 12"The content belongs to its owner. You may download and print it for personal use, without modification, and keep all copyright notices. By downloading, you agree to these terms.
Related Documents