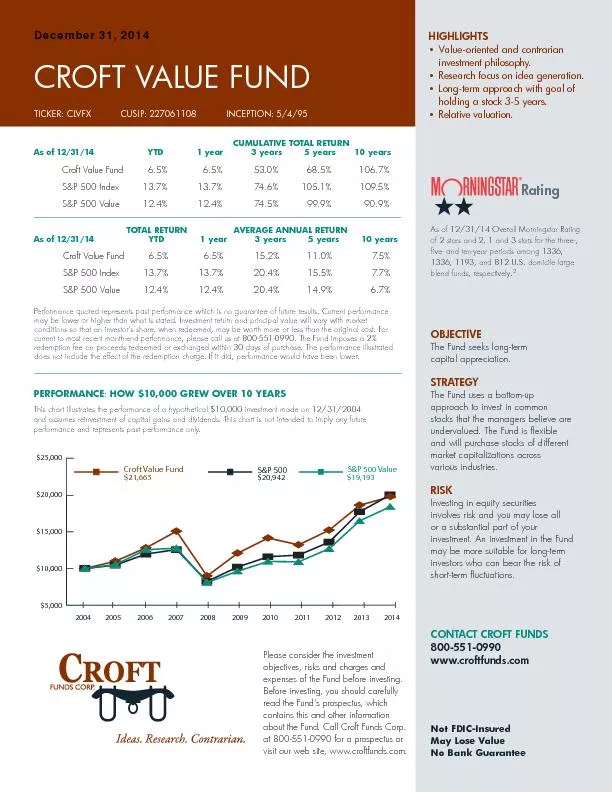
PDF-PERFORMANCEHOW $10,000 GREW OVER 10 YEARSThis chart illustrates the pe
Author : stefany-barnette | Published Date : 2016-03-10
TICKER CLVFX CUSIP 227061108 INCEPTION 5495CROFT VALUE FUNDOBJECTIVEThe Fund seeks longterm capital appreciationSTRATEGYThe Fund uses a bottomup approach to invest
Presentation Embed Code
Download Presentation
Download Presentation The PPT/PDF document "PERFORMANCEHOW $10,000 GREW OVER 10 YEAR..." is the property of its rightful owner. Permission is granted to download and print the materials on this website for personal, non-commercial use only, and to display it on your personal computer provided you do not modify the materials and that you retain all copyright notices contained in the materials. By downloading content from our website, you accept the terms of this agreement.
PERFORMANCEHOW $10,000 GREW OVER 10 YEARSThis chart illustrates the pe: Transcript
Download Rules Of Document
"PERFORMANCEHOW $10,000 GREW OVER 10 YEARSThis chart illustrates the pe"The content belongs to its owner. You may download and print it for personal use, without modification, and keep all copyright notices. By downloading, you agree to these terms.
Related Documents