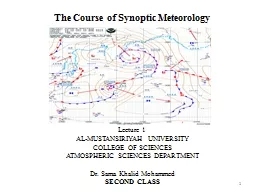
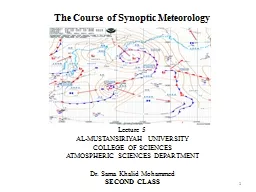
Lecture 2 ALMUSTANSIRIYAH UNIVERSITY COLLEGE OF SCIENCES ATMOSPHERIC SCIENCES DEPARTMENT Dr Sama Khalid Mohammed SECOND CLASS 1 FM SYSTEM OF CODE FORMS Traditional Alphanumeric Codes TAC ID: 562641
Download Presentation The PPT/PDF document "The Course of Synoptic Meteorology" is the property of its rightful owner. Permission is granted to download and print the materials on this web site for personal, non-commercial use only, and to display it on your personal computer provided you do not modify the materials and that you retain all copyright notices contained in the materials. By downloading content from our website, you accept the terms of this agreement.
Slide1
The Course of Synoptic Meteorology
Lecture 2AL-MUSTANSIRIYAH UNIVERSITY COLLEGE OF SCIENCESATMOSPHERIC SCIENCES DEPARTMENT Dr. Sama Khalid MohammedSECOND CLASS
1Slide2Slide3
FM SYSTEM OF CODE FORMS - Traditional Alphanumeric Codes (TAC)
FM 12–XII Ext. SYNOP Report of surface observation from a fixed land stationFM 13–XII Ext. SHIP Report of surface observation from a sea stationFM 14–XII Ext. SYNOP MOBIL Report of surface observation from a mobile land stationFM 15–XIII Ext. METAR Aerodrome routine meteorological report (with or without trend forecast)FM 16–XIII Ext. SPECI Aerodrome special meteorological report (with or without trend forecast)FM 18–XII BUOY Report of a buoy observationFM 20–VIII RADOB Report of ground radar weather observationFM 22–IX Ext. RADREP Radiological data report (monitored on a routine basis and/or in case of accident)FM 32–XI Ext. PILOT Upper-wind report from a fixed land stationFM 33–XI Ext. PILOT SHIP Upper-wind report from a sea stationFM 34–XI Ext. PILOT MOBIL Upper-wind report from a mobile land stationRec. 22 (CBS-89), approved by the President of WMO and Res. 8 (EC-LI)FM 35–XI Ext. TEMP Upper-level pressure, temperature, humidity and wind report from a fixed land stationFM 36–XI Ext. TEMP SHIP Upper-level pressure, temperature, humidity and wind report from a sea stationSlide4
FM SYSTEM OF CODE FORMS - Traditional Alphanumeric Codes (TAC)
FM 37–XI Ext. TEMP DROP Upper-level pressure, temperature, humidity and wind report from a sonde released by carrier balloons or aircraftFM 38–XI Ext. TEMP MOBIL Upper-level pressure, temperature, humidity and wind report from a mobile land stationFM 39–VI ROCOB Upper-level temperature, wind and air density report from a landrocketsonde stationFM 40–VI ROCOB SHIP Upper-level temperature, wind and air density report from a rocketsonde station on a shipFM 41–IV CODAR Upper-air report from an aircraft (other than weather reconnaissance aircraft)FM 42–XI Ext. AMDAR Aircraft report (aircraft meteorological data relay)FM 44–V ICEAN Ice analysisFM 45–IV IAC Analysis in full formFM 46–IV IAC FLEET Analysis in abbreviated formFM 47–IX Ext. GRID Processed data in the form of grid-point valuesFM 49–IX Ext. GRAF Processed data in the form of grid-point values (abbreviated code form)FM 50–XIII WINTEM Forecast upper wind and temperature for aviationFM 51–XIII Ext. TAF Aerodrome forecastFM 53–X Ext. ARFOR Area forecast for aviationFM 54–X Ext. ROFOR Route forecast for aviationSlide5
FM SYSTEM OF CODE FORMS - Traditional Alphanumeric Codes (TAC)
FM 57–IX Ext. RADOF Radiological trajectory dose forecast (defined time of arrival and location)FM 61–IV MAFOR Forecast for shippingFM 62–VIII Ext. TRACKOB Report of marine surface observation along a ship’s trackFM 63–XI Ext. BATHY Report of bathythermal observationFM 64–XI Ext. TESAC Temperature, salinity and current report from a sea stationFM 65-XI Ext. WAVEOB Report of spectral wave information from a sea station or from a remote platform (aircraft or satellite)FM 67–VI HYDRA Report of hydrological observation from a hydrological stationFM 68–VI HYFOR Hydrological forecastFM 71–XII CLIMAT Report of monthly values from a land stationFM 72–XII CLIMAT SHIP Report of monthly means and totals from an ocean weather stationFM 73–VI NACLI CLINP SPCLI CLISA INCLI Report of monthly means for an oceanic areaFM 75–XII Ext. CLIMAT TEMP Report of monthly aerological means from a land stationFM 76–XII Ext. CLIMAT TEMP SHIP Report of monthly aerological means from an ocean weather stationSlide6
FM SYSTEM OF CODE FORMS - Traditional Alphanumeric Codes (TAC)
FM 81–I SFAZI Synoptic report of bearings of sources of atmosphericsFM 82–I SFLOC Synoptic report of the geographical location of sources of atmosphericsFM 83–I SFAZU Detailed report of the distribution of sources of atmospherics bybearings for any period up to and including 24 hoursFM 85–IX SAREP Report of synoptic interpretation of cloud data obtained by a meteorological satelliteFM 86–XI SATEM Report of satellite remote upper-air soundings of pressure, temperature and humidityFM 87–XI SARAD Report of satellite clear radiance observationsFM 88–XI SATOB Report of satellite observations of wind, surface temperature, cloud, humidity and radiationFM SYSTEM OF CODE FORMS – Table Driven Code Forms (TDCF)FM 92–XI Ext. GRIB edition 1 Processed data in the form of grid-point values(gridded binary) expressed in binary formFM 92–XIII Ext. GRIB edition 2 General regularly-distributed information in binary formFM 94–XIII Ext. BUFR Binary universal form for the representation of meteorological dataFM 95–XIII Ext. CREX Character form for the representation and exchange of dataSlide7
7
The code of surface observation has three codes forms:The code of surface observation consists of 6 sections (0-5), and each section contains many groups, each group consist of 5 numbers, the first number called the group identifier as it will be explained later.The code form FM 12 SYNOP is used for reporting synoptic surface observations from a fixed land station, manned or automatic. The code form FM 13 SHIP is used for the same kind of observations from a sea station, manned or automatic. The code form FM 14 SYNOP MOBIL is used for surface observations from an automatic or manned land station not at a fixed location.
The code of surface observation Slide8
8Slide9
9Slide10
10
Section 0: contains information about the station characteristics ( the ship’s call sign, date and time of the observation, and ship’s position at the time of the observation.MiMiMjMj The type of the stationAAXXA SYNOP report from a fixed land stationBBXXA SHIP report from a sea station OOXXA SYNOP MOBIL report from a mobile land station
In a bulletin of SYNOP reports from
fixed land stations
, the groups
M
i
M
i
M
j
M
j
YYGGi
w
shall
be included only as the first line of the text, provided all the reports of the
bulletin were
taken at the same time and use the same unit for reporting wind speed
.
The identification of a
mobile land station or sea station
shall be indicated by the group D . . . . D.Slide11
11
In reports from a mobile land station, only in the absence of a suitable call sign, the word MOBIL shall be used for D . . . . D.YYGGiw YY -- The day of the month
GG -- The hour of the observation (UTC)
i
w
-- Wind type indicator
0 -- m/s (estimated)
1 -- m/s (from anemometer)
2 -- knots (estimated)
3 -- knots (from anemometer
)
/ -- wind speed not available
In reports of sea stations other than buoys, drilling rigs and oil- or gas-production platforms, and in the absence of a ship's call sign, the word SHIP shall be used for D . . . . D.
The identification of stations located at sea on a drilling rig or an oil- or
gas production platform
shall be indicated by the group
A
1
b
w
n
b
n
b
n
b
.Slide12
12
IIiii - International Index Number II - Block number. Block numbers are allocated to one country, part of a country, or several countries in the same region. Not all block numbers are listed on the map, especially for small countries.iii - Station number . These are assigned to individual stations within each country
as station identifiersSlide13
13
LaLaLa -- Latitude of observation to .1 degreesQc -- Quadrant of observation 0 - - at the equator 1 -- North east 3 -- South east 5 -- South west 7 -- North westLoLoLoLo -- Longitude of observation to .1 degrees
For sea station, its position shall
be indicated by the
groups:
99LaLaLa
QcLoLoLoLo
.
for mobile land
stations,
its position shall be indicated by the
groups:
99LaLaLa
QcLoLoLoLo
MMMU
La
U
Lo
and
include the group h
0
h
0
h
0
h
0
i
m
to indicate the elevation of the station, including the units of measure for the elevation and the accuracy of the elevation.
99LaLaLa
QcLoLoLoLo
MMMU
La
U
Lo
h0h0h0h0im
MMM: Number of Marsden squares in which the station is situated at the time of observationSlide14
14
ULaULo : Unit digit in the reported latitude and latitude respectively.h0h0h0h0 Elevation of a mobile land station making surface or upper-air observations, in either metres or feet as indicated by im.
i
R
i
X
hVV
Land Observations
i
R
-- Precipitation
indicator
0 ,1,2 --Precipitation
reported
3,4 --
Precipitation omitted, no
precipitation,
no
observation
i
x
--
Station type and present and past weather
indicator as shown in the following figure:Slide15
15
CodeType of stationGroup 7wwW1W11MannedIncluded2MannedOmitted (no significant phenomenon to report)3Manned
Omitted( no observation, data not available)
4
Automatic
Included
5
Automatic
Omitted (no significant phenomenon to report)
6
Automatic
Omitted (no observation, data not available)
7
Automatic
Included
h : Height above the surface of the base of the lowest cloud seen.Slide16
16
Code figureFeetMeters00-1000-501100-300 50-1002300-600
100-200
3
600-900
200-300
4
900-1900
300- 600
5
1900-3200
600-1000
6
3200-4900
1000-1500
7
4900-6500
1500-2000
8
6500-8000
2000-2500
9
8,000 or higher or no cloud
2500 or higher or no cloud
/
Height of base of cloud is not known.
VV : Horizontal surface visibility
The code is direct reading in units of 100 m from 0 to 50.
The code figures 51 to 55 are not used.
For code figures 56 to 80, 50 is subtracted and the remaining figure is direct reading in units of km.
Code figures 90 to 99 are used to report visibility in the ship synoptic code.Slide17Slide18
18
Nddff - Total Cloud Cover and Wind GroupN : Total cloud cover.
Code figure
Cloud
amount (
oktas
)
Cloud
amount (tenths)
0
0
0
1
1/8 or less,
not zero
1/10 or less,
not zero
2
2/8
2/10 - 3/10
3
3/8
4/10
4
4/85/1055/86/1066/8
7/10 – 8/10
7
7/8 or more but not 8/8
9/10 or more, but
not 10/10
8
8/8
10/10
9
Sky obscured, or cannot be estimated.
/
No measurement madeSlide19Slide20
dd :True wind direction in tens of degrees, from which the wind is blowing.
ff : Wind speed in units indicated by iw.Slide21
1sn
TTT - Air Temperature Group1 : Identifier for the air temperature group.sn : Sign of the temperature. 0 = temperature is positive or zero, 1 = temperature is negative.TTT : Air temperature in tenths of degrees Celsius.2snTdTdTd - Dew Point Temperature Group or Relative Humidity.2 : Identifier for the dew point temperature group.sn : Sign of the dew point temperature. 0 = dew point temperature is positive or zero, 1 = dew point temperature is negative,
9 = relative humidity follows.T
d
T
d
T
d
: Dew point temperature in tenths of degrees Celsius.
3P
0
P
0
P
0
P
0
-
Station Pressure Group
3
: Identifier for the station pressure group.
P
0
P0P
0
P
0
: Pressure at station level, in tenths of a
hPa
.
If the station pressure is more than 999.9
hPa
, drop the thousands digit of the
pressure. Example
: station pressure = 1016.7
hPa
P
0
P
0P0P0= 0167Slide22
22
4PPPP : Sea Level Pressure Group4 : Identifier for sea level pressure group.PPPP : Sea level pressure. This is the station pressure “reduced” to mean sea level in tenths of a hPa.If the sea level pressure is more than 999.9 hPa, the thousands digit of the pressure is omitted.The standard isobaric surface for which the following height is reported.See code table The group 4a3hhh is used, by regional decision,by a high-level station which cannot give pressure at mean sea-level to asatisfactory degree of accuracy. The standard height of an agreedstandard isobaric surface shall be reported.hhh - Geopotential of an agreed standard isobaric surface given by a3,reported in standard geopotential meters, omitting the thousands digit.
4a3hhhSlide23
5appp - 3-Hour Pressure Tendency Group5 :
Identifier for the group reporting pressure tendency and pressure change for the three hours preceding the time of observation.a : Characteristic of the pressure tendency during the three hours preceding the time of the observation. See the following table.ppp : Actual change in the pressure during the three hours ending at the actual time of the observation, expressed in tenths of hPa.Slide24
24
Characteristic of Pressure Tendency (a)0Increasing, then decreasing; atmospheric pressure the same or higher than 3 hours ago.1Increasing, then steady; or increasing, then increasing more slowly.Atmospheric pressure now higher than 3 hours ago.2Increasing (steadily or unsteadily).3Decreasing or steady, then increasing; or increasing, then increasing more rapidly.
4
Steady; atmospheric pressure the same as 3 hours ago.
5
Decreasing, then increasing; atmospheric pressure the same or lower than 3 hours ago.
6
Decreasing, then steady; or decreasing, then decreasing more slowly.
Atmospheric pressure now lower than 3 hours ago.
7
Decreasing (steadily or unsteadily)
8
Steady or increasing, then decreasing; or decreasing, then decreasing more rapidly.Slide25
6RRRtR
- Identifier for the precipitation groupRRR : Total amount of precipitation fallen during the period preceding the time of observation, as indicated by tR.Code figureAmount (mm)Code figureAmount (mm)000Not used990Trace00119910.100229920.2003
3993
0.3
004
4
994
0.4
Etc.
Etc.
995
0.5
987
987
996
0.6
988
988
997
0.7
989
989
998
0.8
999
0.9
t
R
: Length of time covered by the group.
Amount of precipitation
Code figure
Duration of period of precipitation
1
6 hours preceding time of observation
2
12 hours preceding time of observation
3
18 hours preceding time of observation
4
24 hours preceding time of observation
5
1 hour preceding time of observation.
6
2 hour preceding time of observation.
7
3 hour preceding time of observation.
8
9 hour preceding time of observation.
9
15 hour preceding time of observation.Slide26
7wwW1
W2 - Present and Past Weather Group reported from an manned weather station.7 : Identifier for the present and past weather groupww : Present weather at the time of the observation.W1W2 : Past weather. The most significant and the second most significant past weather during the period.CodePast weather0Cloud covering 1/2 or less of the sky throughout the appropriate period.1
Cloud covering more than 1/2 of the sky during part of the appropriate period andcovering 1/2 or less during part of the period.
2
Cloud covering more than 1/2 of the sky throughout the appropriate period.
3
Sandstorm, dust storm, or blowing snow.
4
Fog or ice fog or thick haze.
7
Snow, or rain and snow mixed.
5
Drizzle.
8
Shower(s).
6
Rain.
9
Thunderstorm(s) with or without precipitation.Slide27Slide28Slide29
8Nh
CLCMCH - Cloud Type Group8 : Identifier of the type of cloud group.Nh : Amount of low cloud present. Use code table 2700 with the Nddff group.CL : Clouds of the genera stratocumulus, stratus, cumulus, and cumulonimbus. Use code table 0513.CM : Clouds of the genera Altocumulus, Altostratus, and Nimbostratus. Use code table 0515.CH : Clouds of the genera Cirrus, Cirrocumulus, and Cirrostratus. Slide30Slide31
CL
CodeDiscription0No CL clouds1Cumulus humilis or cumulus fractus other than of bad weather,* or both.2Cumulus mediocris
or congestus
, with or without cumulus of species
fractus
or
humilis
or stratocumulus, all having their bases at the same level.
3
Cumulonimbus
calvus
, with or without cumulus, stratocumulus or stratus.
4
Stratocumulus
cumulogenitus
.
5
Stratocumulus other than stratocumulus
cumulogenitus
.
6
Stratus
nebulosus
or stratus
fractus
other than of bad weather, or both.
7
Stratus
fractus
or cumulus
fractus
of bad weather.
8
Cumulus and stratocumulus other than stratocumulus
cumulogenitus
, with bases at different levels.
9
Cumulonimbus
capillatus
(often with an anvil), with or without cumulonimbus
calvus, cumulus, stratocumulus, stratus or pannus./CL clouds invisible owing to darkness, fog, blowing dust or sand, or … .Slide32Slide33
CM
CodeDiscription0No CM clouds1Altostratus translucidus2Altostratus opacus or nimbostratus3
Altocumulus translucidus
at a single level.
4
Patches (often
lenticular
) of altocumulus
translucidus
, continually changing and occurring at one or more levels.
5
Altocumulus
translucidus
in bands.
6
Altocumulus
cumulogenitus
(or
cumulonimbogenitus
)
7
Altocumulus
translucidus
or
opacus
in two or more layers.
8
Altocumulus
castellanus
or floccus.
9
Altocumulus of a chaotic sky, generally at several levels.
/
CM clouds invisible owing to darkness, fog, blowing dust or sand, or other similar phenomena, or because of continuous layer of lower clouds.Slide34Slide35
Code
Discription0No CH clouds1Cirrus fibratus, sometimes uncinus, not progressively invading the sky.2Cirrus spissatus, in patches or entangled sheaves.3Cirrus spissatus
cumulonimbogenitus
.
4
Cirrus
uncinus
or
fibratus
, or both, progressively invading the sky.
5
Cirrus (often in bands) and cirrostratus, or cirrostratus alone, progressively invading the sky.
6
Cirrus (often in bands) and cirrostratus, or cirrostratus alone, progressively invading the sky; they generally thicken as a whole;.
7
Cirrostratus covering the whole sky.
8
Cirrostratus not progressively invading the sky and not entirely covering it.
9
Cirrocumulus alone, or cirrocumulus predominant among the
C
H
clouds.
/
C
H
clouds invisible owing to darkness, fog, blowing dust or sand, or other similar phenomena, or because of a continuous layer of lower clouds.
C
HSlide36Slide37Slide38