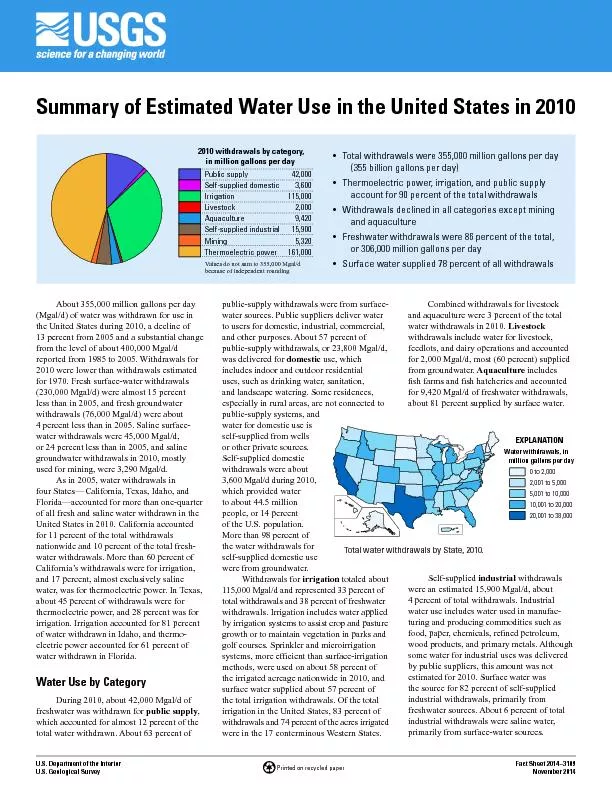
/
Total water withdrawals by State, 2010. Total water withdrawals by State, 2010.

Total water withdrawals by State, 2010. - PDF document

stefany-barnette
stefany-barnette . @stefany-barnette
Follow
390 views
Uploaded On 2016-05-10

Total water withdrawals by State, 2010. - PPT Presentation

EXPLANATIONWater withdrawals in Selfsupplied domestic 3600Aquaculture 9420Selfsupplied industrial 15900Thermoelectric power 161000 2010 withdrawals by category Values do not sum to 355000 Mga ID: 313037

EXPLANATIONWater withdrawals in Self-supplied domestic 600Aquaculture

Share:

Link:

Embed:

Download Presentation from below link

Download Pdf The PPT/PDF document "Total water withdrawals by State, 2010." is the property of its rightful owner. Permission is granted to download and print the materials on this web site for personal, non-commercial use only, and to display it on your personal computer provided you do not modify the materials and that you retain all copyright notices contained in the materials. By downloading content from our website, you accept the terms of this agreement.


Presentation Transcript

Total water withdrawals by State, 2010. EXPLANATIONWater withdrawals, in Self-supplied domestic 3,600Aquaculture 9,420Self-supplied industrial 15,900Thermoelectric power 161,000 2010 withdrawals by category, Values do not sum to 355,000 Mgal/d U.S. Department of the Interior Fact Sheet 2014 – 3109 November 2014 Summary of Estimated Water Use in the United States in 2010  Total withdrawals were 355,000 million gallons per day  Thermoelectric power, irrigation, and public supply  Withdrawals declined in all categories except miningand aquaculture  Freshwater withdrawals were 86 percent of the total,or 306,000 million gallons per day  Surface water supplied 78 percent of all withdrawalsAbout 355,000 million gallons per day (Mgal/d) of water was withdrawn for use in the United States during 2010, a decline of 13 percent from 2005 and a substantial change reported from 1985 to 2005. Withdrawals for or 24 percent less than in 2005, and saline four States — California, Texas, Idaho, and for 11 percent of the total withdrawals California’s withdrawals were for irrigation, water, was for thermoelectric power. In Texas, thermoelectric power, and 28 percent was for Water Use by Categorytotal water withdrawn. About 63 percent of and other purposes. About 57 percent of public-supply withdrawals, or 23,800 Mgal/d, uses, such as drinking water, sanitation, 3,600 Mgal/d during 2010, which provided water to about 44.5 million were from groundwater. Withdrawals for 115,000 Mgal/d and represented 33 percent of total withdrawals and 38 percent of freshwater by irrigation systems to assist crop and pasture golf courses. Sprinkler and micro irrigation methods, were used on about 58 percent of the irrigated acreage nationwide in 2010, and irrigation in the United States, 83 percent of withdrawals and 74 percent of the acres irrigated were in the 17 conterminous Western States. from groundwater. Aquaculture for 9,420 Mgal/d of freshwater withdrawals, about 81 percent supplied by surface water. food, paper, chemicals, re�ned petroleum, wood products, and primary metals. Although the source for 82 percent of self-supplied freshwater sources. About 6 percent of total industrial withdrawals were saline water, Printed on recycled paper 2010 withdrawals by category, in million gallons per day. States are arranged geographically from west to east. 05,00010,00015,00020,000HawaiiAlaskaOregonWashingtonCaliforniaNevadaIdahoArizonaUtahMontanaWyomingNew MexicoColoradoNorth DakotaSouth DakotaNebraskaTexasKansasOklahomaMinnesotaIowaMissouriLouisianaArkansasWisconsinMississippiIllinoisAlabamaTennesseeIndianaKentuckyMichiganGeorgiaOhioFloridaSouth CarolinaWest VirginiaNorth CarolinaVirginiaPennsylvaniaMarylandD.C.New YorkDelawareNew JerseyConnecticutVermontMassachusettsRhode IslandNew HampshireMainePuerto RicoU.S. Virgin IslandsTotal withdrawals, in million gallons per dayWESTEAST Public supplyOther EXPLANATION for extracting solid minerals such as copper, such as hydraulic fracturing. Withdrawals for mining withdrawals were saline water.Water for steam-driven generators. Thermoelectric 73 percent of the surface water used was freshwater. Thermoelectric powerplants accounted for 94 percent of thermoelectric- systems made up the remainder. Large large lakes, or large rivers. About 86 percent were in Eastern States; many Western States A bar graph of water withdrawals by to east, shows the general geographical pattern predominant in many Western States, espepower withdrawals. Generally, thermoelectric power was the largest category of water Water Use Trends, 1950 – 2010 Total withdrawals for 2010 of 355,000 Mgal/d were 13 percent lower than of 409,000 Mgal/d. Water withdrawals, 2010. Withdrawal estimates in 2010 were substantially lower than 2005 for the largest categories of use. Thermoelectric-power percent as the shift to more water-ef�cient irrigation systems continued. Although the Withdrawals also declined for self-supplied domestic use (3 percent) and livestock (7 percent). Withdrawals increased for mining Importance of Water-Use Data for estimates water-use information in cooperadocument how the Nation’s water resources are used. The most recent publication in the summary, is USGS Circular 1405, “Estimated water-use data. By compiling and publishing water-use estimates for the Nation, the USGS provides water-resource planners with the information needed to address issues related to water-resource allocation and environmental Water use also is a key component of the water-budget approach of the National Water http://water.usgs.gov/watercensuswater-use data.Maupin, M.A., Kenny, J.F., Hutson, S.S., Lovelace, J.K., Barber, N.L., andLinsey, K.S., 2014, Estimated use ofhttp://dx.doi.org/10.3133/cir1405 publication, contact: USGS National Water-Use Leadership Team wu-info@usgs.gov Or visit the USGS Water-Use Web site at: http://water.usgs.gov/watuse/ ISSN 2327– 6916 (print) ISSN 2327– 6932 (online) 109