/
DETERMINING if A redistricting plan Complies with the Voting Rights Act DETERMINING if A redistricting plan Complies with the Voting Rights Act

DETERMINING if A redistricting plan Complies with the Voting Rights Act - PowerPoint Presentation

susan2
susan2 . @susan2
Follow
66 views
Uploaded On 2023-11-07

DETERMINING if A redistricting plan Complies with the Voting Rights Act - PPT Presentation

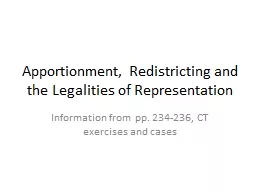
Dr Lisa Handley Redistricting Criteria Priority Pyramid Voting Rights Act of 1965 Section 2 prohibits any voting standard practice or procedure including a redistricting plan that results in the denial or dilution of minority voting strength ID: 1030138

voting minority districts candidates minority voting candidates districts preferred district black analysis elect voters rights contests state redistricting act

Share:

Link:

Embed:

Download Presentation from below link

Download Presentation The PPT/PDF document "DETERMINING if A redistricting plan Comp..." is the property of its rightful owner. Permission is granted to download and print the materials on this web site for personal, non-commercial use only, and to display it on your personal computer provided you do not modify the materials and that you retain all copyright notices contained in the materials. By downloading content from our website, you accept the terms of this agreement.


Presentation Transcript

1. DETERMINING if A redistricting plan Complies with the Voting Rights Act Dr. Lisa Handley

2. Redistricting Criteria Priority Pyramid: Voting Rights Act of 1965Section 2 prohibits any voting standard, practice or procedure, including a redistricting plan, that results in the denial or dilution of minority voting strength.All state and local jurisdictions are covered by Section 2 of the Voting Rights Act.

3. Redistricting plans cannot:crack, orpacka geographically concentrated minority community across districts or within a district in a manner that dilutes their voting strength.Redistricting Plans that Violate the Voting Rights Act 35% 35% 35% 35% 35% 20% 20% 20% 15% 100%Plan that cracks minority community across 5 districtsPlan that packs minority community into single district

4. Thornburg v. Gingles: Three-Pronged Test U.S. Supreme Court held that plaintiffs must satisfy three preconditions to qualify for relief under Section 2 of the Voting Rights Act:The minority group must be sufficiently large and geographically compact to form a majority in a single-member districtThe minority group must be politically cohesiveWhites must vote as a bloc to usually defeat the minority-preferred candidatesA racial bloc voting analysis is used to ascertain whether minority voters are politically cohesive and if white voters bloc vote to usually defeat minority-preferred candidates.

5. Analyzing Voting Behavior by RaceTwo standard statistical techniques for estimating voting patterns of minority and white voters:Ecological regression analysis (ER)Ecological inference analysis (EI)

6. WayneOaklandGeneseeSaginawArea-Specific Analyses

7. Elections Analyzed to DateAll federal and statewide general election contests, 2012-2020. Four election contests included minority candidates:2012 U.S. President (Barack Obama)2014 Secretary of State (Godfrey Dillard)2018 U.S. Senate (John James)2020 U.S. Senate (John James)Two contests included minority candidates as running mates2018 Governor (Gretchen Whitmer/Garlin Gilchrist)2020 U.S. President (Joseph Biden/Kamala Harris)Only Democratic primary for statewide office this past decade: 2018 race for governor

8. Example of RBV Results: 2018 General and Democratic Primary for Governorvotes for office = percentage of voting age population who turned out and cast a vote for the officeHP = vote percentages from homogeneous precinctsER = estimates derived from ecological regression analysisEI 2x2 = estimates derived from standard EI (as developed by Prof. Gary King)EI RxC = estimates derived from EI technique that takes into account differences in participation by race

9. Number of Racially Polarized ElectionsGeneral Elections with Minority Candidates All Statewide General Election ContestsStatewide Democratic PrimaryStatewide6/612/131/1Genesee5/69/131/1Saginaw6/611/131/1Oakland6/613/130/1Wayne3/67/131/1Number of polarized contests / total number of contests

10. Complying with the Voting Rights ActIf, based on the racial bloc voting (RBV) analysis, it is determined voting is racially polarized, and candidates preferred by a politically cohesive minority group are usually defeated by white voters not supporting these candidates, a district(s) that offers minority voters an opportunity to elect their candidates of choice must be drawn. If such districts already exist, and minority-preferred candidates are winning only because these districts exist, then these minority districts must be maintained in a manner that continues to provide minority voters with an opportunity to elect their preferred candidates.

11. Drawing Minority Opportunity Districts Line drawers cannot simply set an arbitrary demographic target (e.g., 50% black voting age population) for all minority districts across the jurisdiction (Alabama Legislative Black Caucus v. Alabama, 2015). A district-specific, functional analysis is required to determine if a proposed district will provide minority voters with the ability to elect minority-preferred candidates to office.

12. District-specific, Function Approaches Estimates of participation rates, minority cohesion and white crossover voting for minority-preferred candidates derived from the RBV analysis can be used to calculate the percent minority population needed in a specific area for minority-preferred candidates to win a district in that area. Election results from previous contests that included minority-preferred candidates (“bellwether elections” as identified by the RBV analysis) can be recompiled to reflect the boundaries of the proposed district to determine if minority-preferred candidates would consistently carry this proposed district.

13.

14.

15.

16.

17.

18. Threshold of Representation: State SenateAll districts over 48% Black elect minority candidates67% of districts over 35% Black elect minority candidatesNo state senate districts between 36 and 45% Black

19. Threshold of Representation: State HouseAll districts over 36% Black elect minority candidates89% of districts over 25% Black elect minority candidatesNo state house districts between 37 and 47% Black

20.