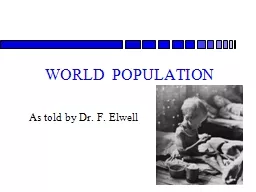
PPT-Distribution of World Population
Author : sylvia | Published Date : 2022-05-31
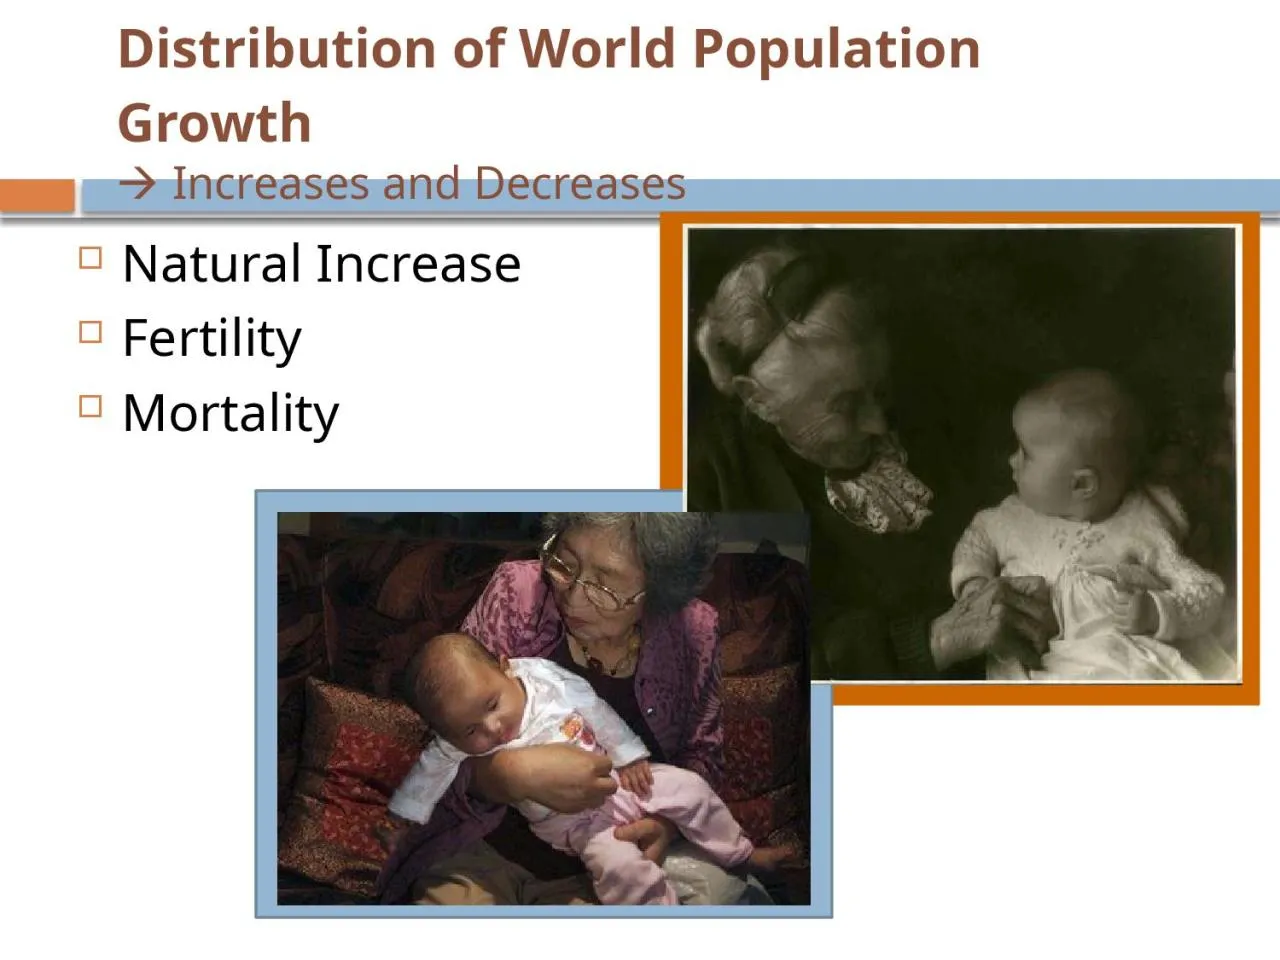
Growth Increases and Decreases Natural Increase Fertility Mortality Natural Increase Rates Fig 27 The natural increase rate NIR is the percentage growth or
Presentation Embed Code
Download Presentation
Download Presentation The PPT/PDF document "Distribution of World Population" is the property of its rightful owner. Permission is granted to download and print the materials on this website for personal, non-commercial use only, and to display it on your personal computer provided you do not modify the materials and that you retain all copyright notices contained in the materials. By downloading content from our website, you accept the terms of this agreement.
Distribution of World Population: Transcript
Download Rules Of Document
"Distribution of World Population"The content belongs to its owner. You may download and print it for personal use, without modification, and keep all copyright notices. By downloading, you agree to these terms.
Related Documents