/
Introduction Introduction

Introduction - PDF document

tabitha
tabitha . @tabitha
Follow
342 views
Uploaded On 2022-10-28

Introduction - PPT Presentation

1 1 
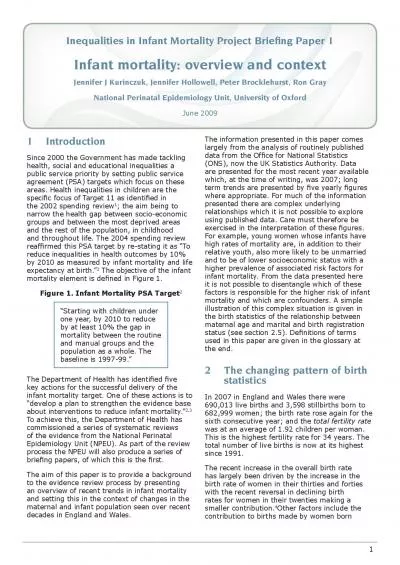
Since 2000 the Government has made tackling health social and educational inequalities a public service priority by setting public service agreement PSA targets which focus on these areas ID: 961543

mortality infant rate births infant mortality births rate x00660069 birth figure live 000 age women wales england 2005 2007

Share:

Link:

Embed:

Download Presentation from below link

Download Pdf The PPT/PDF document "Introduction" is the property of its rightful owner. Permission is granted to download and print the materials on this web site for personal, non-commercial use only, and to display it on your personal computer provided you do not modify the materials and that you retain all copyright notices contained in the materials. By downloading content from our website, you accept the terms of this agreement.


Presentation Transcript

1 Introduction 1 Since 2000 the Government has made tackling health, social and educational inequalities a public service priority by setting public service agreement (PSA) targets which focus on these areas. Health inequalities in children are the speci�c focus of Target 11 as identi�ed in the 2002 spending review 1 ; the aim being to narrow the health gap between socio-economic groups and between the most deprived areas and the rest of the population, in childhood reaf�rmed this PSA target by re-stating it as “To reduce inequalities in health outcomes by 10% by 2010 as measured by infant mortality and life expectancy at birth.” 2 The objective of the infant mortality element is de�ned in Figure 1. Figure 1. Infant Mortality PSA Target 2 The Department of Health has identi�ed �ve key actions for the successful delivery of the infant mortality target. One of these actions is to “develop a plan to strengthen the evidence base about interventions to reduce infant mortality.” 2,3 To achieve this, the Department of Health has commissioned a series of systematic reviews Epidemiology Unit (NPEU). As part of the review process the NPEU will also produce a series of The aim of this paper is to provide a background to the evidence review process by presenting an overview of recent trends in infant mortality and setting this in the context of changes in the maternal and infant population seen over recent decades in England and Wales. largely from the analysis of routinely published (ONS), now the UK Statistics Authority. Data are presented for the most recent year available which, at the time of writing, was 2007; long term trends are presented by �ve yearly �gures where appropriate. For much of the information presented there are complex underlying relationships which it is not possible to explore using published data. Care must therefore be exercised in the interpretation of these �gures. high rates of mortality are, in addition to their relative youth, also more likely to be unmarried and to be of lower socioeconomic status with a higher prevalence of associated risk factors for infant mortality. From the data presented here it is not possible to disentangle which of these factors is responsible for the higher risk of infant mortality and which are confounders. A simple illustration of this complex situation is given in the birth statistics of the relationship between maternal age and marital and birth registration the end. The changing pattern of birth 2 statistics In 2007 in England and Wales there were 690,013 live births and 3,598 stillbirths born to 682,999 women; the birth rate rose again for the sixth consecutive year; and the total fertility rate was at an average of 1.92 children per woman. This is the highest fertility rate for 34 years. The total number of live births is now at its highest since 1991. has largely been driven by the increase in the birth rate of women in their thirties and for

ties with the recent reversal in declining birth rates for women in their twenties making a smaller contribution. Other factors include the contribution to births made by women born Inequalities in Infant Mortality Project Brieng Paper 1 Infant mortality: overview and context Jennifer J Kurinczuk, Jennifer Hollowell, Peter Brocklehurst, Ron Gray National Perinatal Epidemiology Unit, University of Oxford June 2009 Infant mortality: overview and context 2 of women born outside the UK who have higher fertility rates than UK-born women. Trends in maternal age at birth 2.1 The past 40 years has seen profound changes in the pro�le of the fertility of women of different ages (Figure 2). From the mid-1970s onwards the birth rates of women over the age of 30 have consistently increased, which is in marked contrast to the decline in birth rates of women between the ages of 20 and 30 years which was evident until a reversal at the start of the 21 st century. In the 1960s the largest number of births was to women aged 20-24 years. The 1970s saw the predominance of births to women 25-29 which continued until 1999 when they were outstripped for the �rst time by women aged 30-34 years. In 1985 only 27% of births were to women 30 years and over compared with 48% in 2005 (Figure 2). Nineteen percent of births in 2005 were to women 35 years and over compared with only 8% in 1985. The effect of the increasing fertility of ‘older’ women is re�ected in the average maternal age years in 1985 to 27.7 years in 2007. Figure 2. Maternal age at birth, maternities in England and Wales, 1985 to 2005 0%20%40%60%80%100%19851990199520002005Year mateitPecentage 40+yrs 35-39yrs 30-34yrs 25-29yrs 20-24yrs 20yrs Multiple births 2.2 In 2007, 15 in every 1,000 women having a baby in England and Wales delivered twins and 2 in every 10,000 delivered triplets or a higher rate of twining since the collection of records represents the combination of the effects of increasing maternal age at conception and increasing use of infertility treatment, particularly in vitro fertilisation of two or more embryos; in 2004 23% of IVF maternities resulting in a live birth were multiple births. 5 Figure 3. Twining rate per 1,000 maternities* England and Wales, 1938 to 2007** 1012141619381944195019561962196197419801987199319992005Yearof maternitTwinning rateper 1,000 maternitie *Refers to the number of women delivering due to industrial action by registration staff that year The triplet and higher order multiple birth rate (Figure 4) is even more strongly in�uenced by patterns in treatment with IVF and related assisted reproductive technologies (ART). The peak triplet and higher order birth rate was 5 per 10,000 maternities in 1998 when it was nearly �ve times the rate seen in the 1970s. The decline in the rate followed a change in IVF clinical practice and the introduction of the policy of two-embryo transfer (apart from in exceptional circumstances) by the Human Fertilisation and Embryology Authority (HFEA) in

2001. Figure 4. Triplet and higher order rate per 1,000 maternities* England and Wales, 1938 to 2007** 0.000.050.100.150.200.250.300.350.400.450.501938194419501956196219681971980198719931992005Yearof maternitTriplet rateper 1,000 maternitie * Refers to the number of women delivering due to industrial action by registration staff that year Birth weight and gestational age 2.3 The distribution of birth weight has shifted over time with a slight increase in the proportion of low birth weight babies () in 1985 to 7.6% in 2005 (Figure 5). However, recent data are suggestive of a decline with 7.3% of live births in 2007 born weighing less than 2,500g. Infant mortality: overview and context 3 Figure 5. Birth weight distribution* of live births, England and Wales, 1985 to 2005 0%102030405060708090100% 1985 1990 1995 2000 2005Yearof birtPercentage 1,500 1,500-1,999g 2,000-2,499g 2,500-2,999g 3,000-3,499g 3,500+ *Excludes births where the birth weight was not recorded slight increase in the proportion of live births born 3,500g or above from 36.8% in 1985 to 39.5% in 2005. In 2007 39.7% of live births weighted 3,500g or more. Although there is a clear relationship between birth weight and gestational age, low birth weight can be a consequence of poor growth or prematurity or both and gestational age information is needed to distinguish between the two. Gestational age at birth is an important obstetric outcome per se and also a risk factor for adverse outcomes. Gestational age at birth is, however, not recorded at birth registration. This information only became available as part of the recently established new allocation system of NHS numbers for babies (NN4B) , information from which has now been linked to birth registration data. 6 England and Wales data (Figure 6). Figure 6. Gestational age* distribution of live births England and Wales, 2005 6 10152025302232527293133353741Gestational age atbirtPercentage 6 - excludes births where gestational age was not recorded In 2005 the majority (88%) of live births were delivered between 37 and 41 completed weeks gestation which is a full term pregnancy; 6.2% were moderately pre-term (32-36 weeks); 0.9% were very pre-term (28-31 weeks); and 0.5% were extremely pre-term () later. 6 Migration patterns and the impact 2.4 on births Increases in births, decreases in deaths and changes in the pattern of international migration into and out of the United Kingdom have all contributed to recent increases in the size of the general population. The number of births has increased partly due to rising fertility among UK- born women and partly because of an increase in the number of women of childbearing age entering the country as temporary visitors or permanent migrants. This has had a substantial impact on the trends in the proportion of births to women who were themselves born outside the UK. In 1985 just over 12% of live births in England and Wales were to women born outside the UK, by 2005 this proportion had increased to 21% (Figures 7 and 8) and in 2007 was 23%. Figure 7. Maternal country o

f birth, live births England and Wales, 1985 to 2005* 0%10%20%30%40%50%60%70%80%90%100% 985 1995 2000 200earofbirtPercentage Rest ofworl Africa Asia Rest of Europe UK country of birth in that year does not allow the ‘rest of Europe’ to be shown separately from the ‘rest of the world’ born outside the UK to better illustrate that the contribution to births of mothers from different countries in the world has also changed substantially since 1985. Considering only those live births to mothers born outside the UK the proportion born to mothers from the rest of Europe increased from 18% in 1985 to 23% in 2005; the proportion born to mothers from Asia nearly halved from 43% in 1985 to 27% in 2005; the proportion to mothers from Africa remained mothers born in the rest of the world increased �gures and are likely to be different in different areas of the country where migrants make up a larger or smaller proportion of the local population and the distributions of countries of origin vary. Infant mortality: overview and context Figure 8. Maternal country of birth outside the United Kingdom, live births England and Wales, 1985 to 2005* 10152025 1985 1995 2000 200YearofbirtPecentage Rest ofworl Africa Asia Rest of Europe country of birth in that year does not allow the ‘rest of Europe’ to be shown separately from the ‘rest of the world’ Maternal country of origin does not, however, accurately re�ect maternal or infant ethnicity. Recently available data on infant ethnic group collected as part of the recently established NHS numbers for babies (NN4B) system have been linked to birth registration data enabling for the by infant ethnic group (Figure 9). 7 In 2005 65% of births were of White British ethnicity and 5% were of White Irish or other White ethnicity; 3.5% were of mixed ethnicity; 9% were Asian or Asian British; 5% were Black or Black British; 2% were from another ethnic group; and the remaining 11% did not have their ethnicity recorded. Quality checks suggest that births with an unreported ethnic group were largely White. 8 Assuming this to be the case then 75% of births were of White British ethnicity. Figure 9. Ethnic group* distribution of all births, England and Wales, 2005 7 10203040506070809010WhiteMixedAsan orAsan BritisBlck orBlack BritisOther ethnicgrouNot statedEticthe Pecentage * Ethnic group of the baby based on maternal report; data 7 total fertility rate also varies by maternal country of birth with the most recent comparative data available being for births in 2001. In that year the total fertility rate in the UK was 1.6 and the total fertility rate of women born in the UK was also 1.6. However, the total fertility rate of women born outside the UK, who constituted 16.5% of the maternal population in 2001, was 2.2 and for those women born in the Indian subcontinent and Africa the total fertility rate were 2.8. Even within the latter category there was a considerable range from 1.6 for in Pakistan. 9 Parental marital and registration 2.5 status Information

about the marital status of the parents is collected at birth registration. If the parents of the baby are married then either parent may register the birth. If the parents are not married then a joint registration can be made by either both parents being present at the registration or by a statutory declaration about paternity being presented by the registering parent. For unmarried couples and in the absence of a statutory declaration a sole registration is made. As illustrated in Figure 10, the option of joint registration is widely taken up. For this reason the assumption is made that the sole registration group consists largely of lone mothers. Figure 10. Parental marital and registration status, live births England and Wales, 1985 to 2005 0%20406080100% 1985 1990 1995 2000 2005earofbirtPercentage Soleregistration Joint reg diff address Joint reg sameaddress Marrie Substantial changes have taken place between 1985 and 2005 in terms of parental marital status with the largest numerical changes being in the distribution between married couples and couples living at the same address and jointly registering the birth of their baby. Sole registrations have remained relatively constant at around 7%. Joint registrations with the parents living at different addresses have doubled over this period from 3.5% in 1985 to 8.3% in 2005. Whereas joint registration by unmarried couples living at the same address increased three fold from 9% in 1985 to 27% in 2005. Conversely registrations by married couples decreased from 81% to 58% over the same period. The age distribution of mothers varies by their marital and registration status. In 2005 61% of married women were 30 years or over when their Infant mortality: overview and context 5 baby was born; 53% of women whose baby was years; and 56% of sole registrants were under the age of 25. Whilst the proportion of mothers who are sole registrants has remained unchanged at about 7% since 1985 their age distribution has shifted in keeping with the changes in maternal age distribution overall (Figure 11). In 1985 73% of sole registrant mothers were aged less than 11% respectively were over 35. Figure 11. Maternal age distribution of sole registration live births, England and Wales, 1985, 1995 and 2005 101520253035402020-2425-2930-3435MaternalagPercentage 1985 1995 2005 have an age distribution more similar to that of sole registrants (Figure 11) than married women (Figure 13) although they are on average slightly older than the sole registrant group. Figure 12. Maternal age distribution of joint registration live births, England and Wales, 1985, 1995 and 2005. 10152025303540220-2425-2930-3435+MaternalagPecentage 1985 1995 2005 Figure 13. Maternal age distribution of married registration live births, England and Wales, 1985, 1995 and 2005. 101520253035402020-2425-2930-3435+MaternalagPercentage 1985 1995 2005 Socio-economic position 2.6 derived from information about the occupation of their father given at the registration of a 10% random sample of live births although all perinatal

and infant deaths are coded. As a consequence of paternal information being used the socio-economic position for infants born to women who are sole registrants cannot be derived. The coding system used to derive socio-economic position has in the past been revised on a ten yearly basis to coincide with the national census. For births between 1991 and 2000 paternal occupation was coded using the Standard were allocated to the Registrar General’s Social Class. In 2001 SOC2000 was introduced but was quickly followed in 2002 by the National Statistics . 10 NS- SEC is a nominal group system based on a wholly new conceptual basis for the derivation of socio- economic position underpinned by the concept of employment relations which re�ect labour market and work situations. This represents a move away from the prestige, social standing, skill base and hierarchical system of social class. 7,11 NS-SEC has a series of analytical classes. Birth and infant mortality statistics are published using the eight-class version. Socio-economic position and infant mortality are discussed further in Brie�ng Paper 2 in this series. Even with revisions on a ten yearly basis, it is possible to compare trends over time across birth information coded to the Standard Occupational Classi�cation system. However, the introduction of NS-SEC has resulted in a discontinuity for comparative purposes based on published data. ONS undertook a back coding exercise and the results are published in the 2007 report of the review of the infant mortality PSA target. 2 Infant mortality: overview and context 6 Figure 14 illustrates the socio-economic position of live births between 1995 and 2001 categorised by social class. Figure 14. Socio-economic position coded to social class for live births, England and Wales, 1985 to 2001 0%20%40%60%80%10019851987198919911993199519979900YearofbirtPercentage Sole Othe IV&V III III I&II The proportions of births to sole registrants, those coded to social classes III non-manual, IV, V, and the ‘other’ category remained essentially unchanged over the period from 1985 to 2001. In the other three categories there was a general shift with the proportion of births in class III proportion in classes I & II combined increasing changes in the general population and labour market conditions in the UK with the loss of many manual occupations. 10 Figure 15 illustrates the categorisation of socio- economic position of live births from 2001 onwards coded using the NS-SEC classi�cation SEC are given in the glossary. The eight-class version can be collapsed into the following three- class version: groups 1 & 2 are referred to as the ‘routine and manual group’. Group 8 includes fathers who have never worked and the long- term unemployed. Not classi�ed are those who are employed but are unclassi�able and include those where insuf�cient information is provided almost wholly of the not classi�ed group. Over the six year period since the introduc

tion of NS-SEC the proportion of births assigned to each category has remained relatively constant. In 2007 35% of births were coded to the managerial and professional groups; 18% to the intermediate groups; 35% to the routine and manual groups; 5.5% were coded to group registrants (Figure 15). Figure 15. Socio-economic position coded live births, England and Wales, 2001** to 2007 0%20406080100%2001200220032004200520062007Yearof birtPecentage Solere 8 & NC* 7 6 5 4 3 2 1. 1. **Data relating to births in 2001 coded to NS-SEC were presented in 2002 Socio-economic position, ethnic 2.7 group, and parental marital status and maternal age The socio-economic position of infants varies with their ethnicity, the marital status of their parents and age of their mother. Figure 16. Socio-economic position of England and Wales, 2005 7 102030405060BangladeshIndianPataniAfricaCarribeaWhite BrisWhite OtheAll OthersEtc Pecentage 1 & 3 & 5 to 8 & NC 7 based on all births in marriage and joint registrations ** Ethnicity of infant from linkage of NN4B and birth registration data and based on maternal report Figure 16 illustrates the very wide variations in socio-economic position of births in 2005 classi�ed by their ethnic origin. Infants of Indian ethnicity had the highest proportion classi�ed to the managerial and professional groups (47%); infants of Pakistani origin had the highest proportion of infants assigned to the intermediate groups (27%); over 50% of births of Bangladeshi groups; and babies of African ethnic origin had the greatest proportion of fathers who have never worked, were unemployed long term or Infant mortality: overview and context 7 In terms of parental marital status the relative social-economic position of births has not changed over the period since the introduction of the NS-SEC classi�cation system. The �ndings for 2007 (Figure 17) are representative for this period and show that births to married couples are signi�cantly more likely to be classi�ed to managerial and professional groups than births to couples who are not married (47% versus 20% respectively). Conversely births to couples who are not married are signi�cantly more likely than births to married couples (42% versus 29% respectively). Sole registrant mothers account for 15% of the births in the unmarried group. Figure 17. Socio-economic position of live marital status, England and Wales, 2007 101520253035404550MarriedNot marriedParental marital statusPecentage 1 & 3 & 5 to 8 & NC Solere In 2007 less than 6% of births to mothers aged <20 years were classi�ed to the managerial and manual groups; 15% were born to fathers whose occupation was not classi�able; and 22% were born to mothers who were sole registrants (Figure 18). This contrasts markedly with the socio-economic position of births to women who were 30 years and over. Forty-eight percent of professional groups; 19% to the intermediate groups; 26% to the routine and manual groups; were not

classi�able; and only just over 3% had mothers who were sole registrants. Figure 18. Socio-economic position of live age, England and Wales, 2007 0%20%40%60%80%100% 2 20-2 25-2 30Maternal agPecentage Solere 8 & NC* 7 6 5 4 3 2 1. 1. Infant mortality 3 one year of age of babies who were live born (i.e. stillbirths are not included). infant mortality rate number of infant deaths per 1,000 live births divided into two groups: those occurring at less than 28 days after birth, referred to as neonatal deaths; and those occurring at ages 28 days and over but under one year, referred to as postneonatal deaths. Infant mortality rates have for a long time been used as country or regional level proxy indicators of socio-economic position. 9 Infant mortality has also long been regarded as an important indicator of population health. Neonatal mortality rates are especially sensitive to events during pregnancy, delivery and the neonatal period, and to the care given to mothers and their babies. 9 Postneonatal mortality by parental circumstances, including their socio- economic position, and the care they provide for their infant. Trends in infant mortality 3.1 and Wales who died before reaching their �rst birthday. This represents an infant mortality rate of 4.7 deaths in every 1,000 live births. Infant mortality: overview and context 8 Figure 19. Infant, neonatal and postneonatal mortality rates, England and Wales, births 1980 to 2007 101214198019198619891999199820200420YearofbirtMortlity rate per 1,00 live births IM NNM PNMR IMR – infant mortality rate; NNMR – neonatal mortality rate; PNMR – postneonatal mortality rate As illustrated in Figure 19 the infant mortality rate has declined quite steadily from the beginning of the 1980s, although the rate of decline from the early 1990s slowed markedly. The relative contribution of neonatal and postneonatal deaths has also changed during this period. In the late 1980s 55% of infant deaths in the postneonatal period. From 1992 onwards the distribution shifted to between 65-69% neonatal and 31-35% postneonatal. In 2007 the proportions were 69% and 31% respectively. Causes of infant mortality 3.2 Since the introduction of the current stillbirth and possible to directly compare the cause of deaths in the neonatal and postneonatal period because, in contrast to deaths in general (including postneonatal deaths), for neonatal deaths no (ONS) developed a hierarchical classi�cation which allows the infant death to be assigned to a speci�c category based on the likely timing of the the ONS cause of death given in the glossary. The causes of death given in Figure 20 are shown in the hierarchical order of the ONS cause groups. mortality rates by timing of the death, England and Wales, 2007 0.1.2.InfantNeonatalPostneonataTiming ofthe deatInfant mortlity rate per 1,000 live births 1.Cogenital nomalie 2. Anepartum infectio 3. Immaturity 4.Intrapartum causes 5. External condition 6.Infections 7.Other pecific causes 9.udden infantdeaths 0.Unclssified *S

ee the glossary for the de�nition and derivation of the ONS cause groups Immaturity related conditions and congenital anomalies were the two largest grouped causes of death and together accounted for three- quarters of infant deaths overall in 2007 (Table 1). In the neonatal period, immaturity related with 26% due to congenital anomalies; whereas, in the postneonatal period the ranking was reversed with congenital anomalies accounting for 38% of deaths and 20% of deaths being due to immaturity. Table 1. Frequency and cumulative infant deaths, England and Wales, 2007 ONS cause groups % Cumul % Immaturity Congenital anomalies 30 75 Intrapartum causes 7 82 Sudden infant deaths 5 87 91 Infections 96 Antepartum infections 2 98 External conditions 1 99 1 100 Infant mortality by gestational age. 3.3 Gestational age at birth has a profound impact on the infant mortality rate, as illustrated in Infant mortality: overview and context 9 mortality rate*, England and Wales, 2005 6 1020304050607080901,00223252729313335373941Gestational age atbirtInfant mortality rateper 1,000 livebirths * 6 - excludes births where gestational age was not recorded In 2005 the infant mortality rate declined steadily with every week of gestation until 42+ weeks. The infant mortality rate for term (37-41 weeks) births was lower than the overall rate with the lowest rate (1.32 per 1,000) for babies born at Infant mortality by plurality 3.4 Figure 22. Infant mortality rates by plurality, England and Wales, 1995 to 2005 10203040506070809019952000005YearofbirtInfant mortlity rate per 1,000 live births Singletons Twin Triplets *Triplets+ includes higher order multiples The infant mortality for singletons, twins and triplets and higher order multiples has declined over time. However, the relative difference in risk of infant death between the multiples and decade between 1995 and 2005. For births in 2006 (as reported in the 2007 statistics), the infant mortality rate for twins was 22 per 1,000 live births which was nearly �ve times greater than the rate for singletons at 4.4 per 1,000. The infant mortality rate for triplets and higher order multiples was 78 per 1,000 which was nearly 18 times greater than the rate for singletons. Infant mortality trends with 3.5 maternal age, birth registration and parental marital status Infant mortality varies by maternal age in the typical reverse J-shaped curve seen for many years had the lowest infant mortality rate at 4.0 per 1,000 (Figure 23). The rates for women aged 25-29 years and 35-39 years were 4.3 and 4.4 per 1,000 respectively. The rate for women aged 40 years and over was 4.9 and for women 20-24 years the rate was 5.3 per 1,000. Women who were ears when their baby was born had the highest rate of infant death at 7.2 per 1,000. Figure 23. Infant mortality rates per 1,000 live births by maternal age, England and Wales, 2007 0.1.2.3.4.5.6.7.8.2020-2425-2930-3435-3940+ Maternal age grou Infant mortality rateper 1,000 live births The risk of infant death also varies by parental marital status and

birth registration status. In 2007 births registered within marriage had the lowest infant mortality rate at 4.2 per 1,000 live births. Jointly registered births had an intermediate rate of 5.0 per 1,000 and sole registrant births had the highest rate at 6.3 per 1,000. Infant mortality by maternal 3.6 country of birth Infant mortality rates vary by the mother’s own experiencing excess infant deaths were born in Pakistan (9.1 per 1,000), Africa excluding Southern and East Africa (8.0), East Africa (6.2), Bangladesh (5.7), the Caribbean (5.0), and the rest of the world (4.8), although this excess was Pakistan and the ‘Rest’ of Africa. Compared with women overall the excess deaths for women born in Pakistan were both neonatal and postneonatal whereas for women born in the ‘Rest’ of Africa the excess was predominantly in neonatal deaths. Infant mortality: overview and context 10 Figure 24. Infant mortality rate per 1,000 live births by maternal country of birth, England and Wales, 2007 4.4.3.3.5.4.9.6.4.8.2.5.3.4.4.024681OveralUKEURestEuropeBangladesIndiPakistanEastAfricaSouthernAfricaRest ofAfrica A ust, NZ& CanadaCaribbeanRest ofNew CoUSRest ofworlInfant mortality rateper 1,000 livebirths Infant mortality trends with socio- 3.7 economic position Infant mortality varies with socio-economic paternal occupation was coded to social class, there was a clear gradient in the infant mortality rate with the lowest rates in social classes I and II, through to the highest rates in social class V, sole registrants and those in ‘other’ occupations which could not be classi�ed. There was a general reduction in all the rates for the period 1993 to 2001 apart from those in social class V, which remained essentially unchanged over time, and the ‘other’ category, which showed an overall increase over time. Figure 25. Infant mortality rate per 1,000 live births by social class, three year rolling averages, England and Wales, 1993 to 2001 0.2.4.6.8.10.012.014.01993-951994-91995-971996-91997-991998-099-0YearInfant mortlity rate per 1,000 live births Other Sole V IV IIIM IIIN II I Following the introduction of NS-SEC coding it is not possible to make a direct comparison of infant mortality rates between the two coding systems. ONS ‘back-coded’ infant mortality form in the report of the 2006 review of the health inequalities infant mortality PSA target. 2 Rowan examined the effects of the changes in coding on infant mortality and the relationship between rates by classi�cation of socio-economic position. 12 He concluded that rates by social class compared with rates against social class approximated from NS-SEC coding showed very little difference i.e. they were within 0.1 deaths per 1,000 live births, when used at the level of non-manual and manual groups and thus it may be possible to approximate social class from NS- SEC data at this level. Figure 26 illustrates the infant mortality rates by NS-SEC categories using rolling averages for 2002 to 2007. In 2006-07 the lowest rates of infant mortali

ty were seen in NS-SEC groups 1, 2, 4 and 5 with rates between 3.0 and 4.0 per 1,000 and group 3 had a rate of 4.9; all of which were around or under the overall national average of 4.7 per 1,000. Groups 6, 7 and sole registrants ranged from 6.0 to 6.4; and group 8 and unclassi�ed combined had a rate of 8.6. Notably the rate for the latter group had fallen substantially from a rate of 10.2 in 2002-03. Figure 26. Infant mortality rate per 1,000 live births by NS-SEC**, three year rolling averages*, England and Wales, 2002 to 2007 024681012 2006-07*2005-072004-062003-52002-042002-03* Sole reN/Class6734521 Infantmortlity rateper 1,000 live birthsYearofbirt **Socio-economic position coded using the National Statistics Socio-Economic Classi�cation (NS-SEC) * Two year averages for 2002-03 and 2006-07 Infant mortality by grouped causes 3.8 and socio-economic position are very similar for all NS-SEC groups 1 to 7 between groups 1 to 7 and the sole registrants and the group 8 and unclassi�able group. The latter groups experienced a greater proportion deaths from other causes. Infant mortality: overview and context 11 Figure 27. Distribution of grouped causes of infant deaths, by NS-SEC**, England & Wales 2007 0%20%40%60%80%1001 + 4 + 6 + SoleNC*+Socio-economic position (NS-SEC)Pecentageof deaths Othe SIDs Other specific Infectons External IPcauses mmaturity APinfectio Con anom **Socio-economic position coded using the National Statistics Socio-Economic Classi�cation (NS-SEC) AP = Antepartum; IP = Intrapartum European comparisons 3.9 Figure 28 illustrates infant mortality rates across Europe in 2004 using data collected by the EURO-PERISTAT comparisons of rates can be problematic because of difference in de�nitions of both the numerator and denominator of the rate. Some countries exclude births before a speci�ed gestational calculations. The infant mortality rate is the least susceptible of the perinatal indicators to this problem since, with a small number of exceptions In 2004 the lowest infant mortality rates were in Sweden and Norway at 3.0 per 1,000 live births with the highest rate in Latvia at 9.4 per 1,000. The rate for England and Wales is in the bottom third of this European ranking. Figure 28. Infant mortality rates per 1,000 live births by European country,** 2004 13 3.3.3.3.3.3.3.3.3.3.4.4.4.4.4.4.4.4.4.4.4.5.6.6.6.7.8.9.0.02.04.06.08.010.NorwaySwedenFinlanCyprusGreecLuxembourgCzech Rep*BE: FlanderPortugalFranceItalSpain UK: N IrelanAustriGermanyBE: BrusselsDenmarIrelanNetherands*UK: E&UK: ScotlandMalta*Estonia HungarPoland*SlovakReLithuania*LatviaInfant mortality rateper 1,000 live births *Countries where a gestational age or birth weight limit is applied which may affect the rate **Data for the whole of Belgium (BE) and Slovenia are not included Data sources Unless otherwise indicated all the data for England and Wales used in this report were taken patterns of family building in England and Wales series FM1’ and ‘Mortality Statistics: Childhood, Infant, P

erinatal series DH3’ produced by the for Population, Censuses and Surveys). Glossary Infant mortality rate – number of deaths at ages under one year per 1,000 live births Live birth – birth of an infant showing any signs of life regardless of gestation at birth Maternity – a maternity refers to a woman giving birth regardless of the number of babies born (NS-SEC) – a method of coding socio-economic position on the basis of occupation introduced in 2002 to replace the Standard Occupational Registrar General’s Social Class. NS-SEC has a series of analytical classes which are nominal in the extended 14 operational categories form and Infant mortality: overview and context 12 which become ordinal when collapsed into the three-class version. Infant mortality statistics are published using the eight-class analytical version: Large employers and higher managerial 1.2Higher professional Lower managerial and professional Intermediate Small employer and own-account workers Lower supervisory and technical Semi-routine Routine Never worked and long-term unemployed Neonatal mortality rate – number of deaths at ages less than four weeks per 1,000 live births. NHS number for babies (NN4B) – until 2002 NHS numbers were allocated to babies at the point of civil birth registration. In 2002 a new electronic Central Issuing System was introduced to allocate the numbers at birth. Key gestational age and ethnicity, the latter two of which are not collected at birth registration. NS-SEC – see National Statistics Socio-Economic Classi�cation above ONS cause (of death) groups hierarchical – a classi�cation system developed to enable comparison of neonatal and post- neonatal deaths following a change in deaths whereby a single underlying cause of death was no longer assigned. This system allows the death to be assigned hierarchically to a speci�c category based on the likely timing of the damage leading to the death: Before the onset of labour 1.Congenital anomalies Antepartum infections Immaturity related conditions In or shortly after labour Asphyxia, anoxia or trauma Postnatal External conditions Infections Other speci�c conditions Sudden infant deaths Other conditions Postneonatal mortality rate – Number of deaths at 28 days and over but under one year per 1,000 live births. Registration of births – refers to the process of civil registration of birth which is legally required within 42 days of the occurrence of the birth. Registration of deaths – refers to the process of civil registration of a death which requires a death certi�cate from a doctor involved in the then death registration is legally required to be completed within �ve days of the death. Social class – the Registrar General’s classi�cation of social class was derived from coding of occupation which in the case of births was the paternal occupation. Social class has six and V. In 2002 this was replaced by the NS-SEC Socio-economic position

– a concept used to categorise together people who are broadly similar in terms of life-chances and living standards. In the UK, a person’s position in the labour market has traditionally been used to allocate them to a socioeconomic group. Children are usually allocated to their father’s group. Stillbirth gestation showing no signs of life. Total fertility rate – the average number of live children that a group of women would have if they experienced the age-speci�c fertility rates for the year in question throughout their childbearing lifespan. Acknowledgements We would like to thank members of the Infant Mortality Project Advisory Group for their helpful comments on an earlier draft. study which is funded by the Policy Research Programme in the Department of Health. The views expressed are not necessarily those of the References http://www.hmtreasury.gov.uk/d/psa02_ 1. 2. Health. Review of the Health Inequalities Infant Mortality PSA Target. London: Health Inequalities Unit. Implementation 3. Plan for Reducing Health Inequalities in Infant Mortality: A Good Practice Guide. Infant mortality: overview and context 13 Review of the health inequalities infant mortality PSA target. London: Department of Health, 2007. Jefferies J. Fertility assumptions for the Population Trends 2008; 131:19-27. Human Fertilisation and Embryology 5. Authority. A long-term analysis of HFEA Register data 1991-2006. London: HFEA 2007. Moser K, Macfarlane A, Huang Chow Y, 6. on gestation-speci�c infant mortality among babies born in 2005 in England and Wales. Health Statistics Quarterly Autumn 2007;35:13-23. Moser K, Stan�eld KM, Leon DA. Birthweight 7. and gestational age by ethnic group, England and Wales 2005: introducing new data on births. Health Statistics Quarterly Autumn 2008; 39: 22-31. 8. care. NHS Maternity Statistics, England Community Health Statistics. 2007. Whitehead M, Drever F. Narrowing social 9. inequalities in health? Analysis of trends in mortality among babies of lone mothers. Br Rose D, Pevalin D, O’Reilly K. The National 10. Origins, Development and Use. London: Galobardes B, Shaw M, Lawlor SA, 11. Davey Smith G, Lynch J. Indicators of socioeconomic position. In: (eds) Oakes JM, Kaufman JS. Methods in Social Epidemiology. San Francisco, Ca: Jossey-Bass. 2006. p 47- 85. Rowan S. Implications of changes in the 12. United Kingdom social and occupational classi�cations in 2001 on infant mortality statistics. Health Statistics Quarterly Spring EURO-PERISTAT Project, with SCPE, 13. EUROCAT, EURONEOSTAT. European Perinatal Health Report, 2008. Available at: www.europeristat.com Please cite this document as: Jennifer J Kurinczuk, Jennifer Hollowell, Peter Brocklehurst, Ron Gray, Inequalities in infant mortality project brie�ng paper 1. Infant mortality: overview and context. Oxford: National Perinatal Epidemiology Unit, 2009 This brie�ng paper and other Inequalities in Infant Mortality Project reports are available at: www.npeu.ox.ac.uk/infa