/
Economics of gherkin production: analyses of returns to fixed factors Economics of gherkin production: analyses of returns to fixed factors

Economics of gherkin production: analyses of returns to fixed factors - PDF document

tatiana-dople
tatiana-dople . @tatiana-dople
Follow
400 views
Uploaded On 2015-07-28

Economics of gherkin production: analyses of returns to fixed factors - PPT Presentation

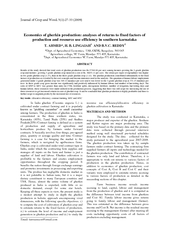
production and resource use efficiency in southern karnataka T AHMED H B LINGAIAH 1 AND BVC REDDY 2 Dept of Agricultural Economics UAS GKVK Bangalore 560 065 1 Agri culture colle ID: 95358

production and resource use efficiency

Share:

Link:

Embed:

Download Presentation from below link

Download Pdf The PPT/PDF document "Economics of gherkin production: analyse..." is the property of its rightful owner. Permission is granted to download and print the materials on this web site for personal, non-commercial use only, and to display it on your personal computer provided you do not modify the materials and that you retain all copyright notices contained in the materials. By downloading content from our website, you accept the terms of this agreement.


Presentation Transcript

Economics of gherkin production: analyses of returns to fixed factors of production and resource use efficiency in southern karnataka T . AHMED*, H. B. LINGAIAH 1 AND B.V.C. REDDY 2 * Dept. of Agricultural Economics, UAS, GKVK, Bangalore. 560 065 1 Agri culture college, VC Farm, Mandya - 571 405 , Karnataka. 2 Dept. of Agricultural Economics VC Farm, Mandya - 571 405 , Karnataka. ABSTRACT Results of the study showed that total costs of gherkin production was Rs.37360.00 per acre among farmers growing the 2 - crop and farmers growing 3 - grade gherkin crop incurred a cost of Rs. 36653.11 per acre. The return per rupee of expenditure was higher in two grade gherkin crop (1.37), than in the three grade gherkin crop (1.12). The gherkin production con tributed substantially to the fixed factors of production as revealed by the cost concepts and income measures used in the analysis. The quantum of human labour employment generated under 2 - grade gherkin crop was 349.12 mandays per acre and it was lower in the 3 - grade gherkin crop at 331.15 mandays per ays. The ratio of MVP to MFC was greater than unity for FYM, fertilizer splits, nit rogenous fertilizer, number of irrigation, harvesting days and human labour, these resources were under - utilized in the production process, suggesting that there was still scope for increasing the use of these resources to get increased returns in case of gherkin crop. It can be concluded that gherkin production is highly profitable and there is further scope to augment profits by the increased use of resources. Key w ords: A llocative e fficiency, c ontract farming, MFC and MVC In India gherkin ( Cucumis angu ria L.) is mpowp cu “rkemnkpi eueuodgt” ot uocnn eueuodgt among farmers. The production of gherkin in India is concentrated in the three southern states, viz . Karnataka (60%) , Tamil Nadu (20%) and Andhr a Pradesh (20%) Contract faming is defined as a system of production and supply of agriculture and horticulture produce by farmers under forward contracts. It basically involves four things; pre - agreed price, quantity or acreage quality and time. Contract f arming is a case for bringing the market to the farmers, which is navigated by agribusiness firms. Gherkin crop is cultivated under total contract type in manages all inputs on the farm and farmer is jus t a supplier of land and labour. Gherkin cultivation is profitable to the farmers and creates employment opportunities throughout the cropping period. It benefits the nation through foreign exchange earnings and promotes investments in processing and expor ting units. The produce has negligible domestic market as it is not palatable to Indian taste, but it is a major dietary constituent to many European countries and USA. Hence, almost the entire volume of gherkin produced in India is exported, with little o r no domestic demand, except for some star hotels. Keeping all these aspects in view, the present study is a modest attempt to study in depth the gherkin production in holistic approach encompassing vivid i. ) to compute the cost of cultivation of gherkin crop and to estimate returns to the fixed factors of production , ii. ) to estimate the level of income and employment generation in gherkin production and iii. ) to study the resource use efficiency/allocati ve efficiency in gherkin cultivation in Karnataka MATERIALS AND METHODS The s tudy was conducted in Karnataka, a major produc er and exporter of the gherkin. Arsikere and Kottur region are major producing area. The study was based on the primary data and the primary data were collected through personal interview - tested schedules designed for the study. The data collected for the study pertained to the agricultural year 2007 - 2008. The gherkin production was taken up by sampl e farmers under contract farming. The contracting firm supplied farmers all inputs and technology needed for the gherkin production. The contribution of contracted farmers was only land and labour. Therefore, it is appropriate to work out returns to variou s factors of production in the gherkin production. Hence, in addition to economics of gherkin production, cost concepts of Cost A, Cost B and Cost C and their variants were employed to estimate returns accruing to various factors of production as detailed in the Farm business income reveals income accruing to land, capital, labour and management from the production of gherkin and it is computed as the difference between total income from gherkins and Cost A1. Family la bour income gives returns going to family labour and management (farmer). This was estimated as the difference between gross income and Cost B. Net income is the residual income accruing to the management (farmer) after meeting all costs including opportun ity costs of all factors of production excluding management. Email: tanveerecon@gmail.com Various cost measures indicated above were computed as detailed below. Cost A 1 : It includes the value of; casual hired labour, attached labour, hired bullock labour, imputed value of own bullo ck labour, hired machine labour, imputed value of owned machine labour, seeds, manures and fertilizers, plant protection chemicals, irrigation charges, interested on working capital, depreciation, land revenue. Cost - A 2 : Cost A 1 + rent paid for leased of la nd, if any Cost - B: Cost - A 2 + imputed rental value of owned land + interest on own fixed capital Cost - C: Cost - B + imputed value of family labour. Cost - C is the total cost of cultivation or gross cost. Analytical tools and techniques For assessing quantita tively the objectives of the study, following analytical tools, techniques and statistical devices were employed. 1. Tabular Analyses: Tabular analyses involving the computation of means, percentages etc were employed to present the data regarding the soci o - economic profile, enterprise analysis, costs and returns, employment generation and other variables. 2. Functional Analyses: To study resource productivity and allocative efficiency in gherkin production, a modified Cobb - Douglas type of production functi on was fitted. This was done with a view to determine the extent to which the important resources that have been quantified, explain the variability in the gross returns of the farming systems and to determine whether the resources were optimally used in t he gherkin production. The general form of the function is y = ax i bi where, 'x i ' is the variable resource, 'y' is the output, 'a' is the constant and 'bi' estimates the extent of relationship between xi and y and when xi is at different magnitudes. The 'b ' coefficient also represents the elasticity of production in the Cobb - Douglas production function analysis. The function of the following form was fitted for the data collected, Y = ax 1 b1 .x 2 b2 .x 3 b3 ………………0x n bn On linearization it becomes logy = loga + b 1 logx 1 + b 2 logx 2 + b 3 logx 3 - ……………0-d n logx n Production function employed for gherkin production as a whole is given below. Log(y) = log(a) + b 1 log(x 1 ) + b 2 log(x 2 ) + b 3 log(x 3 ) + b 4 log(x 4 ) + b 5 log(x 5 ) - …0- d n log(x n ) + E Where, Y = Gross returns in rupees fr om gherkin crop a = Intercept x i = Variable resources (please see table 5 for details) b i = Elasticities of production (i = 1 to n) E = Error term The returns to scale was estimated directly by getting the sum of 'bi' coefficients. The returns will be incre asing, constant or diminishing based on whether value of summation of 'bi' is greater, equal or less than unity, respectively. The ratio of the MVP to MFC of individual resources was used to judge the allocative efficiency. The computed Marginal Value Prod uct (MVP) was compared with the Marginal Factor Cost (MFC) or opportunity cost of the resource to draw inferences. A resource is said to be optimally allocated when its MVP = MFC. The marginal value products (MVP's) were calculated using the geometric mean levels of the variables using the formula. Y MVP of x i th resource = b i x i Where, Y = geometric mean of gross returns. x i = geometric mean of i th independent variable b i = regression coefficient or elasticity of production of i th independent var iable This analysis was carried out in order to identify the possibilities of increasing gross returns under a given farm situation by examining MVP/MFC ratios. RESULT S AND DISCUSSION Gherkin fruits are classified by the gherkin industry into two grade an d three grade crops based on the physical dimension of the fruit. Based on girth size of the fruits, 3 grade crop includes three premium grades i.e., 14.5 mm, 19 mm and 26 mm, incase of 2 grade crop 19 mm and 26 mm is the premium grade. When these grades a re converted into weights, yield will be higher in the case of 2 grade crop as the fruit size will be bigger than that of 3 grade crop (as in case of 3 grade gherkin crop, due importance is given to 14.5 mm size). Input use pattern It was also observed that farmers were applying farm yard manure, tank silt and neem cake to augment the productivity of gherkin crop. Soil dressing of gherkin crop was done in the form of application of tank silt, farm yard manure and neem cake as shown in table 1. It is int eresting to note that the average size of gherkin area was 0.81 acre for the farmers growing 3 - grade crop and for farmers growing 2 - grade crop it was 0.84 acre. Results were converted into per acre basis for comparison between the two types of grades. Gher kin crop is highly labour intensive especially during harvesting season. Therefore labour management is crucial in realizing higher gherkin output. It is observed that the average area under gherkin was less than one acre as farmers can manage the crop wi th required labour force. The results revealed that 2 - grade gherkin crop farmers applied tank silt to the extent of 4.62 tractor loads per acre predominantly in Southern Karnataka where tank silt is available and where as for the 3 - grade gherkin crop f armers applied only 1.36 tractor loads per acre. Regarding application of neem cake and FYM for soil dressing, 3 - grade gherkin crop farmers applied 48.60 kg / ac of neem cake and 7.89 tons/ac of FYM and 2 - grade farmers applied 47.66 kg/ac of neem cake and 9.34 tons/ac of FYM. With respect application of all major nutrients and seed rate, both 3 - grade and 2 - grade crop farmer s were on par with each other (T able1). Optimum seed rate is crucial in gherkin crop to maintain recommended level of plant population. In the survey it was observed that farmers in general were using higher seed at 9796 seeds per acre as against the recommended seed rate of 8000 seeds per acre for 3 - grade gherkin crop and in the 2 - grade gherkin crop the seed rate used was 9456 seeds/ac. G herkin y ield On an average, 2 - grade farmers obtained highest yield of 7345.40 kg per acre, while 3 - grade gherkin crop farmers realized average yields of 4920.85 kg per acre. However, if we look into premium grades, 3 - grade gherkin crop farmers recorded hig hest percentage of premium grade gherkin fruit (88.40), followed by 2 - grade gherkin crop farmers (70.79). (Table 2) Human and bullock l abour engagement The data presented in table 3. revealed that 2 - grade gherkin cropping system required highest number of human labour (349.12 md/ac), followed by 3 - grade gherkin cropping system (331.15 md/ac). The results of foregoing discussion clearly show that gherkin is a highly labour oriented crop. Costs and r eturns It is observed that among the two categories of gher kin crop, total costs in the gherkin production was higher at Rs.37359.69 in the 2 - grade gherkin crop than that of 3 - grade gherkin crop (Rs. 36653.11). Among various cost components, variable cost formed the major cost accounting for more than 90 per cent in both the categories of crop and the total fixed cost was less than 10 per cent in both grades. The average cost per kg of gherkin was higher (Rs. 7.49) in the case of three grade gherkin crop than in two grade crop which was Rs. 5.09. This could be attr ibuted to higher yield in the case of two grade crop (7345.40 kg/ac re ). The net income obtained from the two grade crop was Rs. 13843.02 per acre where as for the three grade crop it was Rs. 4443.70 per acre. Though the proportion of premium grade yield wa s higher in the case of three grade crop, the magnitude of profits was higher in the case of two grade crop in spite of lower price per kg of gherkin under two grade crop system. The returns per rupee of expenditure was observed to be the higher in the tw o grade gherkin crop (1.37), on the contrary it was lower at 1.12 in three grade crop. This is due to higher price realized in the case of three grade crop (Rs. 8.56) and for the two grade crop the break even yield was 5047.30 kg/acre , that is, farmers m ust realize this much of minimum yield to recover their cost. Yield above this level will give farmers profit. Results of the study strongly indicate that gherkin production is highly profitable and it is essential that the crop needs intensive management especially during harvesting season. Income accruing to factors of production in gherkin production The income measures indicated in the table 5 are relevant in the case of gherkin production as the farmer contributes only land and labour. The total inco me from gherkin was Rs. 41097 per acre under 3 grade crop and Rs. 51202 per acre under 2 grade crop. The farm business income which shows income accruing to owned land, owned labour, own long term capital and management was higher at Rs. 24002 per acre in 2 grade crop as against Rs. 14080 of 3 grade crop. That is, returns to owned land and owned capital invested in the business was Rs. 3358 for 2 grade crop and in case of 3 grade crop it was Rs. 2794. This income covers the rental value of land. Similarly, returns going to family labour and management was also higher in 2 grade crop at Rs. 30559 as compared to 3 grade crop (Rs. 29811). Thus, returns to factors of production was higher in the case of 2 grade crop compared to the 3 grade crop. Thus, results r eveal that the gherkin production especially 2 grade crop is profitable to the farmers as it cover s not only the opportunity costs and but also give s a reasonable income to the management. Resource use efficiency and allocative efficiency of resources in gherkin production A Cobb - Douglas type of production function was fitted to data to know the factors influencing gherkin production and to analyze allocative efficiency of resources among gherkin growers in Karnataka state. The results of the regression function are summarized in T able 6. Results revealed that the fitted function was a good fit to the data as the model captured about 60 and 72 per cent of variation in the gherkin output by the independent variables included in the functional analysis as r evealed by the coefficient of multiple determination. Important variables influencing production of gherkin are FYM, seed rate , f ertilizer s plits (Number), N, P, K (kg/ac re ) , amount spent on PPC (Rs./ac), number of irrigations, harvesting days, human lab our, South west monsoon and other seasons. The Marginal Value Product (MVP) of each explanatory variable was computed by multiplying marginal productivity of each factor with product price and compared with its Marginal Factor Cost (MFC) to know the alloca tive efficiency of resources. As input usage was in terms of monetary values, we considered the value of MFC as one rupee for all resources. If the ratio between MVP and MFC is equal to one, it implies optimal allocation of resources or optimal allocative efficiency. If the value of the ratio is either greater than or less than one, it indicates sub - optimal allocation of resources. Thus, if the ratio is greater than one, we can increase profit by using additional quantity of the resource till its ratio is e qual one. The CD - function directly gives returns to uecng kp thg hoto oh ∑d i . In the case of 2 grade there was increasing returns to scale revealing higher profitability of gherkin production as against that of 3 grade crop, in which case there was negative returns to scale. This implies that 3 grade gherkin growers were operating in the III zone of production function with higher input use than recommended. In the case of 3 grade crop, returns to scale was negative, which implies that increase in resource use by o ne percent will result in reduced income. Three grade The regression coefficients of resources for the two categories of crops are presented in T able 6. From the results, it was founded that the regression coefficients of resources used by farmers were p ositive for FYM, nitrogenous fertilizer, amount spent on PPC (Rs./ac re ), harvesting days and human labour and remaining are negative. However, results of the production function analysis showed that only harvesting days and labour were influencing signifi cantly the output of three grade gherkin crop. This could be due to the fact that the contracting firm supplies all required inputs to the farmers at recommended levels, hence, we do not observe any variation in the use of inputs for the crop across farmer s. Therefore non - significance of these variables, on the contrary, number of harvesting days largely depends on the availability of labour hence, their significance statistically. Gross income was significantly and positively affected by these two resource s, which could be interpreted that one per cent increase of human labour and harvesting days would increase gross income to an extent of 0.407 and 0.181 per cent respectively. By increasing these resources one can increase the gross returns. The coefficien t of multiple determination (R 2 ) was 0.60, which indicated that 60.00 per cent of the variation in gross income was explained by the independent variables included in the production function. As depicted in the table, ratios of MVP to MFC were greater than unity for the resources of FYM (38.06), nitrogenous fertilizer (6.13), harvesting days (49.64) human labour (10.87), which showed under - utilization of these resources. There is scope for increasing the use of inputs to increase the gross income. for re maining other variables MVP: MFC ratios were negative implying over - utilization of these resources. The gross income could be increased by withdrawing certain units of these over - utilized resources. The negative ratio of MVP: MFC for resources suggested that there is scope to decrease the use of these resources to increase gross income, keeping all other resources constant. Two grade gherkin The regression coefficients of the resources included in the two grade gherkin crop are presented in the Table 6. I t could be observed from the table that, the regression coefficients for all resources used by the farmers were positive except for phosphorous, potash, South west monsoon and the other season was negative. Only FYM, amount spent on PPC and human labour we re statistically significant at 5 per cent level. That is every one per cent increase in the FYM, amount spent on PPC and human labour, the gross returns increase by 0.030 per cent, 0.290 per cent and 0.173 per cent, respectively. The coefficient of multip le determination (R2) was found to be 0.717. The production function analysis for two grade gherkin crop shows that (Table 6) 71.70 per cent of the variation in gross returns was explained by the independent variables included in the production function. T he table depicts that the ratio of MVP to MFC was greater than unity for FYM (48.57), fertilizer splits (519.19), nitrogenous fertilizer (21.96), number of irrigations (2.74), harvesting days (48.48) human labour (3.68). These ratios reveal that these reso urces were under - utilized in the gherkin production; hence, there is still scope for increased use of resources to get higher returns from gherkin production. The MVP to MFC ratios were less than unity for variables number of seeds (Numbers), and amount s pent on PPC, and negative for Phosphorous, potash fertilizer and seasons revealing over - utilization of these resources in the production process. Thus reducing use of these resources by some units may increase income from gherkin crop production. The foreg oing discussion clearly suggests that gherkin production is highly profitable to gherkin growers especially that of two grade crop and the functional analysis revealed that income from gherkin production can be increased by reorganizing use of some of the resources as revealed by the MVP and MFC ratios. REFERENCES Alagumani, T. and Anjugam, M. 2000 Impact of dairy enterprises on income and employment in Madurai district, Tamil Nadu. 7 th Ann. Conf. of Agri. Eco. Res. Asso. on Livestock Different Farming Systems , Tamil Nadu Veterinary and Animal Sciences University, Chennai, pp.30. Nagaraj, N. and Shivakumarswamy, B. 1995 Economic feasibility of gherkin production in eastern dry zone of Karnataka. Financing Agri. 17 : 16 - 17. Ramesh, T. 1999 Economics of con tact farming: A study of gherkin cultivation in Tamil Nadu . M.Sc. Thesis , UAS Bangalore. Rajeshwari, Y. G. 2004 An economic analysis of coconut based farming system in Tumkur district of Karnataka. M.Sc . (Ag) Thesis , UAS Dharwad. Sree Ramu, B. S., Arun Ku mar, Y. S. and Lakshmipathiah, C. R. 1995 Gherkins: Crop with high export potential. Kisan World ., 22 :49 - 51. Srivastva, G. C. 1993 An empirical investigation into production, marketing and export potential of vegetables in Bihar, Bihar J. Agri. Marketing . 1 :339 - 49. Table.1: Input use pattern in gherkin production. Input s 3 - Grade 2 - Grade N umber of farmers 79 .00 70 Avg. gherkin farm size (acre) 0.81 0.84 Tank silt (Tractor Load No . /acre) 1.36 4.62 FYM (tons/ac re ) 7.98 9.34 Neem cake (kg/ac re ) 48.60 47.66 Seed (No./ac re ) 9796.11 9456.33 Nitrogen (kg/ac re ) 89.23 89.14 Phosphorous (kg/ac re ) 92.80 86.58 Potash (kg/ac re ) 120.45 122.35 Mg So 4 (kg/ac re ) 0.09 0.14 Table 2: Yeild of g herkins under different grade Size 3 - Grade Crop 2 - Grade Crop Yield (kg/ac r e ) Per c ent Average Yield (kg/ac re ) Perc ent 14.5 mm 2069.95 42.06 2946.91 40.12 19 mm 1168.04 23.74 2252.81 30.67 26 mm 1112.14 22.60 % of premium grad 88.40 70.79 Others 570.73 11.60 2145.68 29.21 Total 4920.85 100.00 7345.40 100.00 Table 3 : Employment generation in gherkin production under different grade systems (mandays/acre) Particulars Employment generation 3 - grade crop 2 - grade crop Men l abour (No.) 78.02 78.35 Women l abour (No.) 253.13 270.77 Total human labour 331.15 349.12 Bul lock pair (No.) 9.57 9.85 Table 4: Costs and return of gherkin und er different grade systems (Rs/a cre) Particulars 3 - Grade crop 2 - Grade crop Total / Average Total / Average Cost Variable c ost 33596.65 (91.66) 33766.46 (90.38) Fixed c ost 30 56.46 (8.34) 3593.23 (9.62) Total c ost 36653.11 (100.00) 37359.69 (100.00) Avg. cost /kg 7.49 5.09 Returns Total y ield (Kg/acre) 4920.85 7345.40 Gross i ncome 41096.81 51202.71 Net i ncome 4443.70 13843.02 B: C r atio 1.12 1.37 Averag e p rice 8.56 6.69 Breakeven Yield ( Kg/acre) 3924.84 5047.30 Note: figures in parenthesis indicates the per cent to the total Table 5: Income accruing to factors of production in gherkin production (R s. /acre) Different Cost Concepts 3 - Grade crop 2 - Grade crop Cost - A 1 27017.00 27200.77 Cost - A 2 27017.00 27200.77 Cost - B 29811.46 30558.5 Cost - C 36653.11 37359.69 Returns to f arm business income (income to owned land, owned long term capital and family labour) 14079.81 24001.94 Family labour income ( income owned labour) 11285.35 20644.21 Net income (income to management) 4443.7 13843.02 Table 6. Cobb - Douglas production function estimates and MVP to MFC ratios for 3 and 2 - grade gherkin crop Sl. No Particulars Parameter 3 grade gherkin crop 2 grade gherkin crop Estimated v alues MVP : MFC @ r atios Estimated v alues MVP : MFC r atios 1. Intercept a 2.554 0.766 2. FYM (Tractor load/acre) b 1 0.062 38.06 0.030** 48.57 3. Seeds (No .) b 2 - 0.094 - 0.05 0.011 0.01 4. Fertilizer Splits (No. ) b 3 - 0.072 - 54.36 0.491 519.19 5. N (Kg) b 4 0.110 6.13 0.264 21.96 6. P (Kg) b 5 - 0.255 - 13.50 - 0.046 - 3.93 7. K (Kg) b 6 - 0.026 - 1.06 - 0.023 - 1.37 8. PPC (Rs./acre) b 7 0.128 0.27 0.290** 0.91 9. N o. of i rrigations b 8 - 0.075 - 9.04 0.014 2.74 10. Harvesting days (N o. ) b 9 0.407** 49.64 0.303 48.48 11. Labour (Man days) b 10 0.181** 10.87 0.173** 3.68 12. SW Monsoon b 11 - 0.199 - 0.065 13. Other seasons b 12 - 0.233 - 0.117 ∑ d i - 0.066 1.325 R 2 0.600 0.717 ** Significant at (P=0.05) leve l of significance @ Since all independent variables are expressed in monetary values, MFC was one rupee for each input with the exception of FYM , no. of irrigations, harvesting days and labour. Table 6. Cobb-Douglas production function estimates and MVP to MFC ratios for 3 and 2-grade gherkin crop Sl. No Particulars Parameter 3 grade gherkin crop 2 grade gherkin crop Estimated v alues MVP : MFC @ r atios Estimated v alues MVP : MFC r atios 1. Intercept a 2.554 0.766 2. FYM (Tractor load/acre) b 1 0.062 38.06 0.030** 48.57 3. Seeds (No .) b 2 - 0.094 - 0.05 0.011 0.01 4. Fertilizer Splits (No. ) b 3 - 0.072 - 54.36 0.491 519.19 5. N (Kg) b 4 0.110 6.13 0.264 21.96 6. P (Kg) b 5 - 0.255 - 13.50 - 0.046 - 3.93 7. K (Kg) b 6 - 0.026 - 1.06 - 0.023 - 1.37 8. PPC (Rs./acre) b 7 0.128 0.27 0.290** 0.91 9. N o. of i rrigations b 8 - 0.075 - 9.04 0.014 2.74 10. Harvesting days (N o. ) b 9 0.407** 49.64 0.303 48.48 11. Labour (Man days) b 10 0.181** 10.87 0.173** 3.68 12. SW Monsoon b 11 - 0.199 - 0.065 13. Other seasons b 12 - 0.233 - 0.117 i - 0.066 1.325 R 2 0.600 0.717 ** Significant at (P=0.05) level of significance @ Since all independent variables are expressed in monetary values, MFC was one rupee for each input with the exception of FYM, no. of irrigations, harvesting days and labour. Table 3: Employment generation in gherkin production under different grade systems (mandays/acre) Particulars Employment generation 3 - grade crop 2 - grade crop Men l abour (No.) 78.02 78.35 Women l abour (No.) 253.13 270.77 Total human labour 331.15 349.12 Bul lock pair (No.) 9.57 9.85 Table 4: Costs and return of gherkin under different grade systems (Rs/a Particulars 3 - Grade crop 2 - Grade crop Total / Average Total / Average Cost Variable c ost 33596.65 (91.66) 33766.46 (90.38) Fixed c ost 30 56.46 (8.34) 3593.23 (9.62) Total c ost 36653.11 (100.00) 37359.69 (100.00) Avg. cost /kg 7.49 5.09 Returns Total y ield (Kg/acre) 4920.85 7345.40 Gross i ncome 41096.81 51202.71 Net i ncome 4443.70 13843.02 B: C r atio 1.12 1.37 Averag e p rice 8.56 6.69 Breakeven Yield ( Kg/acre) 3924.84 5047.30 Note: figures in parenthesis indicates the per cent to the total Table 5: Income accruing to factors of production in gherkin production /acre) Different Cost Concepts 3 - Grade crop 2 - Grade crop Cost - A 1 27017.00 27200.77 Cost - A 2 27017.00 27200.77 Cost - B 29811.46 30558.5 Cost - C 36653.11 37359.69 Returns to f arm business income (income to owned land, owned long term capital and family labour) 14079.81 24001.94 Family labour income ( income owned labour) 11285.35 20644.21 Net income (income to management) 4443.7 13843.02 independent variables included in the production function. The table depicts that the ratio of MVP to MFC was greater than unity for FYM (48.57), fertilizer splits (519.19), nitrogenous fertilizer (21.96), number of irrigations (2.74), harvesting days (48.48) human labour (3.68). These ratios reveal that these resources were under-utilized in the gherkin production; hence, there is still scope for increased use of resources to get higher returns from gherkin production. The MVP to MFC ratios were less than unity for variables number of seeds (Numbers), and amount spent on PPC, and negative for Phosphorous, potash fertilizer and seasons revealing over-utilization of these resources in the production process. Thus reducing use of these resources by some units may increase income from gherkin crop production. The foregoing discussion clearly suggests that gherkin production is highly profitable to gherkin growers especially that of two grade crop and the functional analysis revealed that income from gherkin production can be increased by reorganizing use of some of the resources as revealed by the MVP and MFC ratios. REFERENCES Alagumani, T. and Anjugam, M. 2000 Impact of dairy enterprises on income and employment in Madurai district, Tamil Nadu. Ann. Conf. of Agri. Eco. Res. Asso. on Livestock Different Farming Systems, Tamil Nadu Veterinary and Animal Sciences University, Chennai, pp.30. Nagaraj, N. and Shivakumarswamy, B. 1995 Economic feasibility of gherkin production in eastern dry zone of Karnataka. Financing Agri.: 16-17. Ramesh, T. 1999 Economics of contact farming: A study of gherkin cultivation in Tamil NaduM.Sc. Thesis, UAS Bangalore.Rajeshwari, Y. G. 2004 An economic analysis of coconut based farming system in Tumkur district of Karnataka. M.Sc. (Ag) ThesisUAS Dharwad. Sree Ramu, B. S., Arun Kumar, Y. S. and Lakshmipathiah, C. R. 1995 Gherkins: Crop with high export potential. Kisan World:49-Srivastva, G. C. 1993 An empirical investigation into production, marketing and export potential of vegetables in Bihar,Bihar J. Agri. Marketing:339-Table.1: Input use pattern in gherkin production. Input s 3 - Grade 2 - Grade N umber of farmers 79 .00 70 Avg. gherkin farm size (acre) 0.81 0.84 Tank silt (Tractor Load No . /acre) 1.36 4.62 FYM (tons/ac re ) 7.98 9.34 Neem cake (kg/ac re ) 48.60 47.66 Seed (No./ac re ) 9796.11 9456.33 Nitrogen (kg/ac re ) 89.23 89.14 Phosphorous (kg/ac re ) 92.80 86.58 Potash (kg/ac re ) 120.45 122.35 Mg So 4 (kg/ac re ) 0.09 0.14 Table 2: Yeild of gherkins under different grade Size 3 - Grade Crop 2 - Grade Crop Yield (kg/ac r e ) Per c ent Average Yield (kg/ac re ) Perc ent 14.5 mm 2069.95 42.06 2946.91 40.12 19 mm 1168.04 23.74 2252.81 30.67 26 mm 1112.14 22.60 % of premium grad 88.40 70.79 Others 570.73 11.60 2145.68 29.21 Total 4920.85 100.00 7345.40 100.00 profitable to the farmers as covers not only the opportunity costs and but also gives a reasonable income to the management. Resource use efficiency and allocative efficiency of resources in gherkin production A Cobb-Douglas type of production function was fitted to data to know the factors influencing gherkin production and to analyze allocative efficiency of resources among gherkin growers in Karnataka state. The results of the regression function are summarized in Table 6. Results revealed that the fitted function was a good fit to the data as the model captured about 60 and 72 per cent of variation in the gherkin output by the independent variables included in the functional analysis as revealed by the coefficient of multiple determination. Important variables influencing production of gherkin are FYM, seed ratefertilizer splits (Number), N, P, K (kg/ac), amount spent on PPC (Rs./ac), number of irrigations, harvesting days, human labour, South west monsoon and other seasons. The Marginal Value Product (MVP) of each explanatory variable was computed by multiplying marginal productivity of each factor with product price and compared with its Marginal Factor Cost (MFC) to know the allocative efficiency of resources. As input usage was in terms of monetary values, we considered the value of MFC as one rupee for all resources. If the ratio between MVP and MFC is equal to one, it implies optimal allocation of resources or optimal allocative efficiency. If the value of the ratio is either greater than or less than one, it indicates sub-optimal allocation of resources. Thus, if the ratio is greater than one, we can increase profit by using additional quantity of the resource till its ratio is equal one. The CD- function directly gives returns to uecng kp thg hoto oh ∑d. In the case of 2 grade there was increasing returns to scale revealing higher profitability of gherkin production as against that of 3 grade crop, in which case there was negative returns to scale. This implies that 3 grade gherkin growers were operating in the III zone of production function with higher input use than recommended. In the case of 3 grade crop, returns to scale was negative, which implies that increase in resource use by one percent will result in reduced income. Three grade The regression coefficients of resources for the two categories of crops are presented in Table 6. From the results, it was founded that the regression coefficients of resources used by farmers were positive for FYM, nitrogenous fertilizer, amount spent on PPC (Rs./ac), harvesting days and human labour and remaining are negative. However, results of the production function analysis showed that only harvesting days and labour were influencing significantly the output of three grade gherkin crop. This could be due to the fact that the contracting firm supplies all required inputs to the farmers at recommended levels, hence, we do not observe any variation in the use of inputs for the crop across farmers. Therefore non-significance of these variables, on the contrary, number of harvesting days largely depends on the availability of labour hence, their significance statistically. Gross income was significantly and positively affected by these two resources, which could be interpreted that one per cent increase of human labour and harvesting days would increase gross income to an extent of 0.407 and 0.181 per cent respectively. By increasing these resources one can increase the gross returns. The coefficient of multiple determination (R) was 0.60, which indicated that 60.00 per cent of the variation in gross income was explained by the independent variables included in the production function. As depicted in the table, ratios of MVP to MFC were greater than unity for the resources of FYM (38.06), nitrogenous fertilizer (6.13), harvesting days (49.64) human labour (10.87), which showed under- utilization of these resources. There is scope for increasing the use of inputs to increase the gross income. for remaining other variables MVP: MFC ratios were negative implying over-utilization of these resources. The gross income could be increased by withdrawing certain units of these over-utilized resources. The negative ratio of MVP: MFC for resources suggested that there is scope to decrease the use of these resources to increase gross income, keeping all other resources constant. Two grade gherkin The regression coefficients of the resources included in the two grade gherkin crop are presented in the Table 6. It could be observed from the table that, the regression coefficients for all resources used by the farmers were positive except for phosphorous, potash, South west monsoon and the other season was negative. Only FYM, amount spent on PPC and human labour were statistically significant at 5 per cent level. That is every one per cent increase in the FYM, amount spent on PPC and human labour, the gross returns increase by 0.030 per cent, 0.290 per cent and 0.173 per cent, respectively. The coefficient of multiple determination (R2) was found to be 0.717. The production function analysis for two grade gherkin crop shows that (Table 6) 71.70 per cent of the variation in gross returns was explained by the Input use pattern was also observed that farmers were applying farm yard manure, tank silt and neem cake to augment the productivity of gherkin crop. Soil dressing of gherkin crop was done in the form of application of tank silt, farm yard manure and neem cake as shown in table 1. It is interesting to note that the average size of gherkin area was 0.81 acre for the farmers growing 3-grade crop and for farmers growing 2-grade crop it was 0.84 acre. Results were converted into per acre basis for comparison between the two types of grades. Gherkin crop is highly labour intensive especially during harvesting season. Therefore labour management is crucial in realizing higher gherkin output. It is observed that the average area under gherkin was less than one acre as farmers can manage the crop with required labour force. The results revealed that 2-grade gherkin crop farmers applied tank silt to the extent of 4.62 tractor loads per acre predominantly in Southern Karnataka where tank silt is available and where as for the 3-grade gherkin crop farmers applied only 1.36 tractor loads per acre. Regarding application of neem cake and FYM for soil dressing, 3-grade gherkin crop farmers applied 48.60 kg / ac of neem cake and 7.89 tons/ac of FYM and 2-grade farmers applied 47.66 kg/ac of neem cake and 9.34 tons/ac of FYM. With respect application of all major nutrients and seed rate, both 3-grade and 2-grade crop farmers were on par with each other (Table1). Optimum seed rate is crucial in gherkin crop to maintain recommended level of plant population. In the survey it was observed that farmers in general were using higher seed at 9796 seeds per acre as against the recommended seed rate of 8000 seeds per acre for 3-grade gherkin crop and in the 2-grade gherkin crop the seed rate used was 9456 seeds/ac. Gherkin yieldOn an average, 2-grade farmers obtained highest yield of 7345.40 kg per acre, while 3-grade gherkin crop farmers realized average yields of 4920.85 kg per acre. However, if we look into premium grades, 3-grade gherkin crop farmers recorded highest percentage of premium grade gherkin fruit (88.40), followed by 2-grade gherkin crop farmers (70.79). (Table 2) Human and bullock labour engagementThe data presented in table 3. revealed that 2-grade gherkin cropping system required highest number of human labour (349.12 md/ac), followed by 3-grade gherkin cropping system (331.15 md/ac). The results of foregoing discussion clearly show that gherkin is a highly labour oriented crop. Costs and returns It is observed that among the two categories of gherkin crop, total costs in the gherkin production was higher at Rs.37359.69 in the 2-grade gherkin crop than that of 3-grade gherkin crop (Rs. 36653.11). Among various cost components, variable cost formed the major cost accounting for more than 90 per cent in both the categories of crop and the total fixed cost was less than 10 per cent in both grades. The average cost per kg of gherkin was higher (Rs. 7.49) in the case of three grade gherkin crop than in two grade crop which was Rs. 5.09. This could be attributed to higher yield in the case of two grade crop (7345.40 kg/ac). The net income obtained from the two grade crop was Rs. 13843.02 per acre where as for the three grade crop it was Rs. 4443.70 per acre. Though the proportion of premium grade yield wahigher in the case of three grade crop, the magnitude of profits was higher in the case of two grade crop in spite of lower price per kg of gherkin under two grade crop system. The returns per rupee of expenditure was observed to be the higher in the two grade gherkin crop (1.37), on the contrary it was lower at 1.12 in three grade crop. This is due to higher price realized in the case of three grade crop (Rs. 8.56) and for the two grade crop the break even yield was 5047.30 kg/acre , that is, farmers must realize this much of minimum yield to recover their cost. Yield above this level will give farmers profit. Results of the study strongly indicate that gherkin production is highly profitable and it is essential that the crop needs intensive management especially during harvesting season. Income accruing to factors of production in gherkin production The income measures indicated in the table 5 are relevant in the case of gherkin production as the farmer contributes only land and labour. The total income from gherkin was Rs. 41097 per acre under 3 grade crop and Rs. 51202 per acre under 2 grade crop. The farm business income which shows income accruing to owned land, owned labour, own long term capital and management was higher at Rs. 24002 per acre in 2 grade crop as against Rs. 14080 of 3 grade crop. That is, returns to owned land and owned capital invested in the business was Rs. 3358 for 2 grade crop and in case of 3 grade crop it was Rs. 2794. This income covers the rental value of land. Similarly, returns going to family labour and management was also higher in 2 grade crop at Rs. 30559 as compared to 3 grade crop (Rs. 29811). Thus, returns to factors of production was higher in the case of 2 grade crop compared to the 3 grade crop. Thus, results reveal that the gherkin production especially 2 grade crop is Various cost measures indicated above were computed as detailed below. Cost A It includes the value of; casual hired labour, attached labour, hired bullock labour, imputed value of own bullock labour, hired machine labour, imputed value of owned machine labour, seeds, manures and fertilizers, plant protection chemicals, irrigation charges, interested on working capital, depreciation, land revenue. Cost-A Cost A + rent paid for leased of nd, if any Cost- Cost-A + imputed rental value of owned land + interest on own fixed capital Cost- Cost-B + imputed value of family labour. Cost-C is the total cost of cultivation or gross cost. Analytical tools and techniquesFor assessing quantitatively the objectives of the study, following analytical tools, techniques and statistical devices were employed. 1.Tabular Analyses: Tabular analyses involving thecomputation of means, percentages were employed to present the data regarding the socio-economic profile, enterprise analysis, costs and returns, employment generation and other variables. 2.Functional Analyses: To study resourceproductivity and allocative efficiency in gherkin production, a modified Cobb-Douglas type of production function was fitted. This was done with a view to determine the extent to which the important resources that have been quantified, explain the variability in the gross returns of the farming systems and to determine whether the resources were optimally used in the gherkin production. The general form of the function is y = axwhere, 'x' is the variable resource, 'y' is the output, 'a' is the constant and 'bi' estimates the extent of relationship between xi and y and when xi is at different magnitudes. The 'b' coefficient also represents the elasticity of production in the Cobb-Douglas production function analysis. The function of the following form was fitted for the data collected, Y = axb1 b2 ………………0xOn linearization it becomes logy = loga + blogxlogx + blogx- ……………0-dlogxProduction function employed for gherkin production as a whole is given below. Log(y) = log(a) + blog(x+ blog(x+ blog(xlog(xlog(x- …0- dlog(x) + E Where, = Gross returns in rupees from gherkin crop a= Intercept = Variable resources (please see table 5 for details) = Elasticities of production (i = 1 to n) = Error term The returns to scale was estimated directly by getting the sum of 'bi' coefficients. The returns will be increasing, constant or diminishing based on whether value of summation of 'bi' is greater, equal or less than unity, respectively. The ratio of the MVP to MFC of individual resources was used to judge the allocative efficiency. The computed Marginal Value Product (MVP) was compared with the Marginal Factor Cost (MFC) or opportunity cost of the resource to draw inferences. A resource is said to be optimally allocated when its MVP = MFC. The marginal value products (MVP's) were calculated using the geometric mean levels of the variables using the formula. Y MVP of x i th resource = b i x i Where, Y = geometric mean of gross returns. = geometric mean of i independent variable = regression coefficient or elasticity of production of i independent variable This analysis was carried out in order to identify the possibilities of increasing gross returns under a given farm situation by examining MVP/MFC ratios. RESULTS AND DISCUSSION Gherkin fruits are classified by the gherkin industry into two grade and three grade crops based on the physical dimension of the fruit. Based on girth size of the fruits, 3 grade crop includes three premium grades i.e., 14.5 mm, 19 mm and 26 mm, incase of 2 grade crop 19 mm and 26 mm is the premium grade. When these grades are converted into weights, yield will be higher in the case of 2 grade crop as the fruit size will be bigger than that of 3 grade crop (as in case of 3 grade gherkin crop, due importance is given to 14.5 mm size). Economics of gherkin production: analyses of returns to fixed factors of production and resource use efficiency in southern karnataka T.AHMED*, H. B. LINGAIAHB.V.C. REDDYDept. of Agricultural Economics, UAS, GKVK, Bangalore. 560 065Agriculture college, VC Farm, Mandya- 571 405, Karnataka. Dept. of Agricultural Economics VC Farm, Mandya-571 405, Karnataka. ABSTRACT Results of the study showed that total costs of gherkin production was Rs.37360.00 per acre among farmers growing the 2-grade gherkin crop and farmersgrowing 3-grade gherkin crop incurred a cost of Rs. 36653.11 per acre. The return per rupee of expenditure was higher in two grade gherkin crop (1.37), than in the three grade gherkin crop (1.12). The gherkin production contributed substantially to the fixed factors of production as revealed by the cost concepts and income measures used in the analysis. The quantum of human labour employment generated under 2-grade gherkin crop was 349.12 mandays per acre and it was lower in the 3-grade gherkin crop at 331.15 mandays per acre. In three grade crop gross income was significantly and positively influenced by human labour and number of harvesting days. The ratio of MVP to MFC was greater than unity for FYM, fertilizer splits, nitrogenous fertilizer, number of irrigation, harvesting days and human labour, these resources were under-utilized in the production process, suggesting that there was still scope for increasing the use of these resources to get increased returns in case of gherkin crop. It can be concluded that gherkin production is highly profitable and there is further scope to augment profits by the increased use of resources. Key words: Allocative efficiency, contract farming, MFC and MVC In India gherkin (Cucumis anguria L.) is cultivated under contract farming and it is popularly mpowp cu “rkemnkpi eueuodgt” ot uocnn eueuodgt among farmers. The production of gherkin in India is concentrated in the three southern states, Karnataka (60%), Tamil Nadu (20%) and AndhrPradesh(20%) Contract faming is defined as a system of production and supply of agriculture and horticulture produce by farmers under forward contracts. It basically involves four things; pre-agreed price, quantity or acreage quality and time. Contract farming is a case for bringing the market to the farmers, which is navigated by agribusiness firms. Gherkin crop is cultivated under total contract type in India, under which the contracting firm supplies and manages all inputs on the farm and farmer is just a supplier of land and labour. Gherkin cultivation is profitable to the farmers and creates employment opportunities throughout the cropping period. It benefits the nation through foreign exchange earnings and promotes investments in processing and exporting units. The produce has negligible domestic market as it is not palatable to Indian taste, but it is a major dietary constituent to many European countries and USA. Hence, almost the entire volume of gherkin produced in India is exported, with little or no domestic demand, except for some star hotels. Keeping all these aspects in view, the present study is a modest attempt to study in depth the gherkin production in holistic approach encompassing vivid dimensions, with the following specific objectives. ) to compute the cost of cultivation of gherkin crop and to estimate returns to the fixed factors of production) to estimate the level of income and employment generation in gherkin production and iii.) to study the resource use efficiency/allocative efficiency in gherkin cultivation in Karnataka MATERIALS AND METHODS The study was conducted in Karnataka, a major producer and exporter of the gherkin. Arsikere and Kottur region are major producing area. The study was based on the primary data and the primary data were collected through personal interview method using well structured/ pre-tested schedules designed for the study. The data collected for the study pertained to the agricultural year 2007-The gherkin production was taken up by samplfarmers under contract farming. The contracting firm supplied farmers all inputs and technology needed for the gherkin production. The contribution of contracted farmers was only land and labour. Therefore, it is appropriate to work out returns to various factors of production in the gherkin production. Hence, in addition to economics of gherkin production, cost concepts of Cost A, Cost B and Cost C and their variants were employed to estimate returns accruing to various factors of production as detailed in the succeeding sections of this chapter.Farm business income reveals income accruing to land, capital, labour and management from the production of gherkin and it is computed as the difference between total income from gherkins and Cost A1. Family labour income gives returns going to family labour and management (farmer). This was estimated as the difference between gross income and Cost B. Net income is the residual income accruing to the management (farmer) after meeting all costs including opportunity costs of all factors of production excluding management. Email: tanveerecon@gmail.com Economics of gherkin production: analyses of returns to fixed factors of production and resource use efficiency in southern karnataka T.AHMED*, H. B. LINGAIAHB.V.C. REDDYDept. of Agricultural Economics, UAS, GKVK, Bangalore. 560 065Agriculture college, VC Farm, Mandya- 571 405, Karnataka. Dept. of Agricultural Economics VC Farm, Mandya-571 405, Karnataka. ABSTRACT Results of the study showed that total costs of gherkin production was Rs.37360.00 per acre among farmers growing the 2-grade gherkin crop and farmersgrowing 3-grade gherkin crop incurred a cost of Rs. 36653.11 per acre. The return per rupee of expenditure was higher in two grade gherkin crop (1.37), than in the three grade gherkin crop (1.12). The gherkin production contributed substantially to the fixed factors of production as revealed by the cost concepts and income measures used in the analysis. The quantum of human labour employment generated under 2-grade gherkin crop was 349.12 mandays per acre and it was lower in the 3-grade gherkin crop at 331.15 mandays per acre. In three grade crop gross income was significantly and positively influenced by human labour and number of harvesting days. The ratio of MVP to MFC was greater than unity for FYM, fertilizer splits, nitrogenous fertilizer, number of irrigation, harvesting days and human labour, these resources were under-utilized in the production process, suggesting that there was still scope for increasing the use of these resources to get increased returns in case of gherkin crop. It can be concluded that gherkin production is highly profitable and there is further scope to augment profits by the increased use of resources. Key words: Allocative efficiency, contract farming, MFC and MVC In India gherkin (Cucumis anguria L.) is cultivated under contract farming and it is popularly mpowp cu “rkemnkpi eueuodgt” ot uocnn eueuodgt among farmers. The production of gherkin in India is concentrated in the three southern states, Karnataka (60%), Tamil Nadu (20%) and AndhrPradesh(20%) Contract faming is defined as a system of production and supply of agriculture and horticulture produce by farmers under forward contracts. It basically involves four things; pre-agreed price, quantity or acreage quality and time. Contract farming is a case for bringing the market to the farmers, which is navigated by agribusiness firms. Gherkin crop is cultivated under total contract type in India, under which the contracting firm supplies and manages all inputs on the farm and farmer is just a supplier of land and labour. Gherkin cultivation is profitable to the farmers and creates employment opportunities throughout the cropping period. It benefits the nation through foreign exchange earnings and promotes investments in processing and exporting units. The produce has negligible domestic market as it is not palatable to Indian taste, but it is a major dietary constituent to many European countries and USA. Hence, almost the entire volume of gherkin produced in India is exported, with little or no domestic demand, except for some star hotels. Keeping all these aspects in view, the present study is a modest attempt to study in depth the gherkin production in holistic approach encompassing vivid dimensions, with the following specific objectives. ) to compute the cost of cultivation of gherkin crop and to estimate returns to the fixed factors of production) to estimate the level of income and employment generation in gherkin production and iii.) to study the resource use efficiency/allocative efficiency in gherkin cultivation in Karnataka MATERIALS AND METHODS The study was conducted in Karnataka, a major producer and exporter of the gherkin. Arsikere and Kottur region are major producing area. The study was based on the primary data and the primary data were collected through personal interview method using well structured/ pre-tested schedules designed for the study. The data collected for the study pertained to the agricultural year 2007-The gherkin production was taken up by samplfarmers under contract farming. The contracting firm supplied farmers all inputs and technology needed for the gherkin production. The contribution of contracted farmers was only land and labour. Therefore, it is appropriate to work out returns to various factors of production in the gherkin production. Hence, in addition to economics of gherkin production, cost concepts of Cost A, Cost B and Cost C and their variants were employed to estimate returns accruing to various factors of production as detailed in the succeeding sections of this chapter.Farm business income reveals income accruing to land, capital, labour and management from the production of gherkin and it is computed as the difference between total income from gherkins and Cost A1. Family labour income gives returns going to family labour and management (farmer). This was estimated as the difference between gross income and Cost B. Net income is the residual income accruing to the management (farmer) after meeting all costs including opportunity costs of all factors of production excluding management. Email: tanveerecon@gmail.com