/
Factors controlling cloud droplet concentration in low clou Factors controlling cloud droplet concentration in low clou

Factors controlling cloud droplet concentration in low clou - PowerPoint Presentation

tatiana-dople
tatiana-dople . @tatiana-dople
Follow
431 views
Uploaded On 2015-10-16

Factors controlling cloud droplet concentration in low clou - PPT Presentation

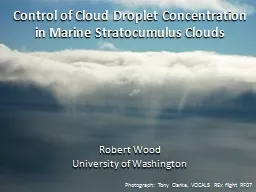
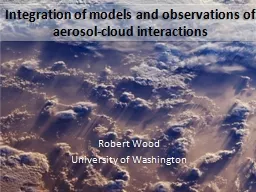
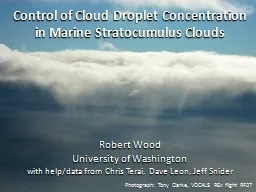
Photograph Tony Clarke VOCALS REx flight RF07 Robert Wood University of Washington with helpdata from Dan Grosvenor Daniel McCoy Chris Terai Matt Lebsock Dave Leon Jeff Snider Tony Clarke ID: 163061

cloud ccn droplet concentration ccn cloud concentration droplet clouds observed modis drizzle budget sea aerosol source model vocals 100

Share:

Link:

Embed:

Download Presentation from below link

Download Presentation The PPT/PDF document "Factors controlling cloud droplet concen..." is the property of its rightful owner. Permission is granted to download and print the materials on this web site for personal, non-commercial use only, and to display it on your personal computer provided you do not modify the materials and that you retain all copyright notices contained in the materials. By downloading content from our website, you accept the terms of this agreement.


Presentation Transcript

Slide1

Factors controlling cloud droplet concentration in low clouds over the oceans

Photograph: Tony Clarke, VOCALS

REx flight RF07

Robert Wood

University of Washington

with help/data from Dan Grosvenor, Daniel McCoy, Chris

Terai

, Matt

Lebsock

, Dave Leon, Jeff Snider, Tony ClarkeSlide2

Radiative impact of geographical variations in cloud droplet concentration

George and Wood,

Atmos. Chem. Phys., 2010

cloud droplet

concentration

N

d

albedo

enhancement

(fractional)Slide3

“Background” (minimum imposed) cloud droplet concentration influences aerosol indirect effects

Quaas

et al., AEROCOM (Atmos. Chem. Phys., 2009) Hoose et al. (GRL, 2009)

Low

N

d

background

 strong

Twomey

effect

High

N

d

background  weaker Twomey effect

A  ln(Nperturbed/Nunpertubed)

LANDOCEAN

Forcing [W m

-2]

0 10 20 30 40 Slide4

Aerosol (d>0.1 m

m) vs cloud droplet concentration (VOCALS, SE Pacific)

1:1 line

see also...

Twomey

and Warner (1967) Martin et al. (1994)Slide5

Extreme coupling between drizzle and CCN

Southeast PacificDrizzle causes cloud morphology transitions and depletes aerosolsSlide6

MODIS-estimated mean cloud droplet concentration

Nd

Use method of Boers and Mitchell (1996), applied by

Bennartz

(2007)

Screen to remove heterogeneous clouds by insisting on

CF

liq

>0.6 in daily L3 Slide7

Cloud droplet concentrations in marine stratiform

low cloud over oceanLatham et al.,

Phil. Trans. Roy. Soc. (2012)The view from MODIS

....how can we explain this distribution?

N

d

[cm

-3

]

Minimum values

imposed in GCMs

(instantaneous mean

over 1x1

o

boxes)Slide8

CCN/cloud droplet concentration budget with sources (specified) and sinks due to drizzle (for weak source, i.e. low CCN conc.) and aerosol coagulation (strong source, i.e. high CCN conc.)

Stable regimes generated at point A (drizzle) and B (coagulation)Observed marine CCN/Nd values mostly fall in unstable regime!

Baker and Charlson, Nature (1990)

observations

10 100 1000

CCN concentration [cm

-3

]

CCN loss rate [cm

-3

day

-1

]

200

100

0-100-200

-300-400-500Baker and Charlson modelSlide9

Baker and Charlson

modelStable region A exists because CCN loss rates due to drizzle increase strongly with CCN concentrationIn the real world this is probably not the case, and loss rates are constant with CCN conc.

However, the idea of a simple CCN budget model is alluring

Baker and

Charlson

,

Nature

(1990)

observations

10 100 1000

CCN concentration [cm

-3

]

CCN loss rate [cm

-3

day-1]

2001000-100-200-300-400-500Slide10

Prevalence of drizzle from low clouds

Leon et al., J. Geophys. Res. (2008)

Drizzle occurrence = fraction of low clouds (1-4 km tops) for which Zmax> -15

dBZ

DAY NIGHTSlide11

Simple CCN budget in the MBL

Model accounts for:

EntrainmentSurface production (sea-salt)Coalescence scavenging

Dry deposition

Model does not account for:

New particle formation – significance still too uncertain to include

AdvectionSlide12

Production terms in CCN budget

FT Aerosol concentration

MBL depth

Entrainment rate

Wind speed at 10 m

Sea-salt

parameterization-dependent

constant

We use Clarke et al. (

J.

Geophys

. Res.

, 2007) at 0.4%

supersaturation

to represent an upper limitSlide13

Sea-spray flux parameterizations

Courtesy of Ernie Lewis, Brookhaven National Laboratory

u10=8 m s-1Slide14

Loss terms in CCN budget: (1) Coalescence scavenging

Precip

. rate at cloud base

MBL depth

Constant

cloud thickness

Wood,

J.

Geophys

. Res.

, 2006

Comparison against results from stochastic collection equation (SCE) applied to observed size distributionSlide15

Loss terms in CCN budget: (2) Dry deposition

Deposition velocity

w

dep

= 0.002 to 0.03 cm s

-1

(

Georgi

1988)

K

= 2.25

m

2

kg-1 (Wood 2006)For PCB = > 0.1 mm day-1 and h = 300 m

= 3 to 30

For precip rates > 0.1 mm day-1, coalescence scavenging dominatesSlide16

Steady state (equilibrium) CCN concentrationSlide17

Variable

Source

Details

N

FT

Weber and

McMurry

(1996)

&

VOCALS

in-situ observations (next slide)

150-200 cm

-3

active at 0.4% SS in remote FT

D

ERA-40

Reanalysis

divergent regions in monthly mean

U

10

Quikscat

/Reanalysis

-

P

CB

CloudSat

PRECIP-2C-COLUMN,

Haynes et

al. (2009) & Z-based retrieval

h

MODIS

LWP, adiabatic assumption

z

i

CALIPSO

or

MODIS

or COSMIC

MODIS

T

top

, CALIPSO

z

top

, COSMIC

hydrolapse

Observable constraints from A-TrainSlide18

MODIS-estimated cloud droplet concentration N

d, VOCALS Regional Experiment

Data from Oct-Nov 2008Slide19

Free tropospheric

CCN source

S = 0.9%

S = 0.25%

Data from VOCALS (Jeff Snider)

Continentally-

influenced FT

Remote “background” FT

Weber and

McMurry

(FT, Hawaii)

S=0.9%

0.5

0.25

0.1Slide20

Remote SE Pacific FT CCN spectrum very similar with that at Mauna LoaSlide21

Conceptual model of background FT aerosol

Clarke et al. (

J. Geophys. Res. 1998)Slide22

Self-preserving aerosol size distributions

after Friedlander, explored by Raes:

Raes et al., J. Geophys. Res. (1995)

Fixed

supersaturation

: 0.8% 0.4% 0.2%

Variable

supersat

.

0.3

 0.2%

Kaufman and

Tanre

(Nature 1994)Slide23

Precipitation and FT CCN over the VOCALS regionSlide24

Predicted and observed N

d, VOCALS17.5-22.5oS

Model increase in

N

d

toward coast is related to

reduced drizzle

and explains the majority of the observed increase

Very close to the coast (<5

o

) an additional CCN source is requiredEven at the heart of the Sc sheet (80oW) coalescence scavenging halves the NdResults relatively insensitive to sea-salt flux parameterizationSlide25

Sensitivity to sea-salt parameterizationSlide26

Predicted and observed N

d Monthly climatological means (2000-2009 for MODIS, 2006-2009 for

CloudSat) Derive mean for locations where there are >3 months for which there is: (1) positive large scale div.

(2) mean cloud top height <4 km

(3) MODIS liquid cloud fraction > 0.4Slide27
Slide28

Predicted and observed

N

d

- histograms

Minimum values

imposed in GCMs

Histograms are monthly means for 1x1

o

boxesSlide29

Predicted and observed

N

d

- histogramsSlide30

Predicted and observed

N

d

- histogramsSlide31
Slide32

Reduction of N

d from precipitation sink

0 10 20 50 100 150 200 300 500 1000 2000 %

Precipitation from

midlatitude

low clouds reduces

N

d

by a factor of 5

In coastal subtropical Sc regions,

precip

sink is weakSlide33

Sea-salt source strength compared with entrainment from FTSlide34

Conclusions

Simple CCN budget model, constrained with precipitation rate estimates from CloudSat predicts MODIS-observed cloud droplet concentrations in regions of persistent low level clouds with some skill. Entrainment of constant “self-preserving” aerosols from FT (and sea-salt in regions of stronger mean winds) can provide sufficient CCN to supply MBL. No need for internal MBL source (e.g. from DMS).

Significant fraction of the variability in Nd across regions of extensive low clouds is likely related to drizzle sinks rather than source variability => implications for aerosol indirect effectsSlide35

Southern Ocean Annual Cycle

Wood et al. (2013)

Marked annual cycle of Nd in low clouds over Southern Ocean

Summer maximum likely biogenic (DMS?)

In-situ and satellite observations consistent

Summer maximum (70 cm

-3

); Winter minimum (35 cm

-3

)

Twomey

effect 25%

Not well captured in models (e.g. CAM5) Slide36

Annual cycle of cloud droplet concentration

MODIS

CAM 5

NH Springtime maximum captured in CAM 5

SH Subtropical cycle reasonably well-captured

Southern Ocean annual cycle not well-capturedSlide37

Monthly

Nd anomaly(monthly mean – annual mean)Slide38

CloudSat precipitation

Wintertime maximum for low cloud precipitation likely, but annual cyle not particularly strong (range: 1.2-1.5 mm day-1)Outstanding retrieval problems

over Southern OceanCold-topped clouds