/
ICICI Securities Ltd.| Retail Equity Research ICICI Securities Ltd.| Retail Equity Research

ICICI Securities Ltd.| Retail Equity Research - PDF document

tatiana-dople
tatiana-dople . @tatiana-dople
Follow
406 views
Uploaded On 2016-04-16

ICICI Securities Ltd.| Retail Equity Research - PPT Presentation

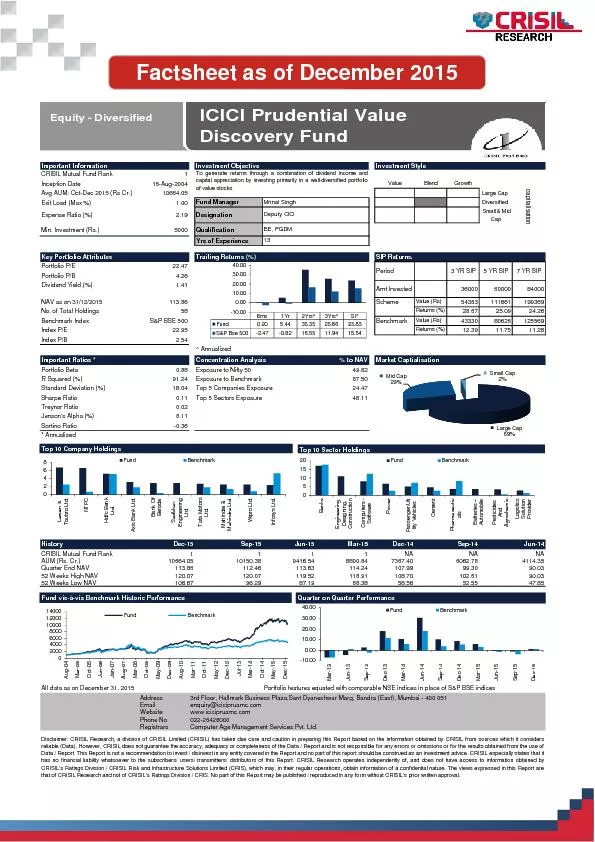
April 24 2015 MotoGaze April 2015 March ends on flattish note Weak rural demand impacts volumes For March 2015 overall auto industry sales volumes declined 1 YoY This happened mainly after t ID: 281352

April 2015 MotoGaze April

Share:

Link:

Embed:

Download Presentation from below link

Download Pdf The PPT/PDF document "ICICI Securities Ltd.| Retail Equity Res..." is the property of its rightful owner. Permission is granted to download and print the materials on this web site for personal, non-commercial use only, and to display it on your personal computer provided you do not modify the materials and that you retain all copyright notices contained in the materials. By downloading content from our website, you accept the terms of this agreement.


Presentation Transcript

ICICI Securities Ltd.| Retail Equity Research April 24, 2015 MotoGaze April 2015 March ends on flattish note!!! Weak rural demand impacts volumes For March 2015, overall auto industry sales volumes declined ~1% YoY. This happened mainly after the government’s decision to roll back excise Sector View Volume performance… CompanyGr. YoY(%)Hero Motocorp1.5 Key players & industry volume growth – Mar’15 (%) -17.76.01.82.5-12.4 YoYgr MoM gr Source: Siam Key players & industry volume growth YTD (%) 6.219.311.9-11.3-0.3HMCLHMSITMLHyundaiALL YTD gr Research AnalystVidrum Mehta vidrum.mehta@icicisecurities.com | Retail Equity Research Two & three wheeler industry Weaker rural demand coupled with lower export growth impacted the overall 2-W industry sales volumes, which declined ~2% YoY for March 2015. Motorcycle volumes declined 6% YoY, with the decline led by BAL and HMSI volumes decline of ~22% YoY and ~24% YoY, respectively. The scooter segment continued to outperform the industry registering growth of ~10% YoY mainly lead by Honda’s “Activa” and TVS Motors The three-wheeler industry at 78,329 units has grown ~15% YoY, with the domestic segment witnessing sluggish growth of ~3% YoY while the export market registered strong growth at ~35% YoY. In the segment, market leader BAL witnessed volume growth of ~21% YoY. Market share movement According to data released by the Society of Indian Automobile Manufacturers (Siam), the domestic market share of two and three-wheeler players as of March 2015 is mentioned below. Domestic market share movement in two-wheelers 11.1Bajaj AutoHero MotocorpTVS motorHMSIOthers(%) Mar-14 Source: Siam, Data used is YTD Domestic market share movement in two-wheelers 38.913.013.344.332.010.644.132.310.705101520253035404550Bajaj AutoPiaggioM&MOthers(%) Feb-15 Mar-15 Source: Siam, Data used is YTD Although the 2-W segment is witnessing an overall slowdown due to weak rural demand, segment leaders HMCL and HMSI witnessed modest growth maintaining their market share on an MoM basis. Growth in the scooter segment helped TVS to capture some of Bajaj Auto’s market share, which was impacted due to a sharp decline in its motorcycle sales The domestic 3W market also registered muted growth of ~3% YoY | Retail Equity Research Domestic market share movement in motorcycles 16.5Bajaj AutoHero MotocorpTVS motorHonda Source: Company, ICICIdirect.com Research Domestic market share movement in scooters/scooterettes 55.5Hero MotocorpTVS MotorsHondaOthers Source: Siam, Data used is YTD Hero MotoCorp continues to be the market leader in the executive and economy segments. Lower discretionary spending has started to hit this segment HMSI continues to be the clear leader in the scooter segment, which is one of the fastest growing segments in the entire automobile industry. HMSI has continued to gain market share in the scooter segment while HMCL lost market share | Retail Equity Research Market share movement in executive motorcycle () Mar-13Apr-13Aug-13Feb-14Mar-14Apr-14Aug-14Feb-15Mar-15 Bajaj Auto (RHS) Hero Motocorp TVS (RHS) HMSI (RHS) Source: Siam * only top 4 two-wheeler OEMs Market share movement in greater than 125 cc segment Mar-13Apr-13May-13Aug-13Nov-13Feb-14Mar-14Apr-14May-14Aug-14Nov-14Feb-15Mar-15 Bajaj Auto (LHS) Hero Motocorp (RHS) TVS (RHS) HMSI (RHS) Source: Siam *only top thr HMCL continues to dominate the executive motorcycle segment (=125 cc) in India. HMCL, HMSI and TVS have gained market share while BAL has substantially lost market share over the last 12 months | Retail Equity Research Hero MotoCorp (HERHON) Hero MotoCorp, the market leader in the 2-W segment, witnessed ~2% YoY volume growth and was largely impacted by lower discretionary spending and weak rural demand The motorcycle segment at 4.7 lakh units grew ~4% YoY while scooter volumes declined ~13% YoY impacting overall volumes. Unlike its peers, HMCL’s scooters segment growth declined with “Pleasure” reporting sharp de-growth while Maestro remained almost flat for the month Exports declined sharply by 38% YoY to 11,327 units. This can mainly be attributed to the sharp fall in exports of its scooter brand “Pleasure” and motorcycle brand “Super Splendor”. management expects exports to start contributing more meaningfully, going forward, as the markets seeded in the previous year start showing traction in a few quarters Volume performance (in units) SegmentMar-15Mar-14%chgFeb-15%chg TD'15 TD'14%chgMotorcycles471,983 455,731 3.6415,967 5,778,355 5,789,930 -0.2Scooters 59,767 68,297 -12.5 68,802 -13.1 853,384 455,965 Total Sales 531,750 524,028 484,769 9.7 6,631,739 6,245,895 Export(inc. above) 11,327 18,257 -38.0 9,518 19.0 197,605 115,540 Exports (% of sales) 2.1 3.5 -135 bps 2.0 17 bps 3.0 1.8 113 bps Source: Company, SiamBajaj Auto (BAAUTO) Over the past few months, Bajaj Auto’s volume performance in domestic markets has been under pressure as its entry-level segment ()YoY drop in volumes, mainly after the fall in sales of its “Discover” &#x=125;&#x cc ;&#xhas ;&#xseen;&#x ~41;&#x% 60;units. However, the 125 cc segment has done well with growth of ~18% YoY The three-wheeler (3-W) segment has seen a strong rebound in volumes in the domestic market (~39% YoY growth). However the export market has witnessed sluggish growth of ~4% YoY For FY15, exports contribution stands at ~47% YoY compared to ~41% last year, due to a decline in domestic volumes and the low base of last year. The management believes demand from the export market would revive while new motorcycle launches are likely to spur growth and help gain market share in the domestic Volume performance (in units) SegmentMar-15Mar-14%chgFeb-15 TD'15 TD'14%chgTotal 2-wheeler sales209,937270,591-22.4216,0773,309,7803,422,416-3.32W exports80,567100,709-20.093,711-14.01,528,6961,323,17315.52W domestic sales129,370169,882-23.8122,3665.71,781,0842,099,243-15.2Total 3-wheeler sales40,66733,73920.527,24249.3523,417447,67416.93W exports18,13617,4743.819,198281,981260,7628.13w domestic sales22,53116,26538.58,044180.1241,436186,91229.2Total Sales250,604304,330-17.7243,3193.03,833,1973,870,090-1.0Total Domestic Sales151,901 186,147 -18.4130,410 16.52,022,520 2,286,155 -11.5Total Exports98,703118,183-16.5112,909-12.61,810,6771,583,93514.3Exports as % of sales39.438.855 bps46.4-702 bps47.240.9631 bps Source: Company, Siam Hero MotoCorp: Sales volumes 100200300400500600Mar'14May'14Jul'14Sep'14Nov'14Jan'15Mar'15('000s)100('000s) Motorcycles Scooters Source: Siam, ICICIdirect.com Research Bajaj Auto: Sales volumes 271262268262264247Mar'14May'14Sep'14Nov'14Mar'15('000s)(%) Two-Wheelers Three-Wheelers % exportsSource: Siam, ICICIdirect.com Research | Retail Equity Research Overall volumes for March 2015, at ~2.1 lakh units grew ~7% YoY. Motorcycle segment grew 13% YoY to 76,936 units mainly after strong growth in its “Starcity” and “Apache”. The scooter segment grew 14% YoY to 54,666 units with “Jupiter” driving the growth of the segment The moped segment witnessed de-growth of 6% YoY to 68,636 units, with domestic volumes declining ~5% YoY and exports volumes declining substantially by ~45% YoY Export markets have continued to do well for TVS with the segment growing ~42% YoY for the month. Three-wheeler exports at ~9,827 units grew ~49% YoY in March 2015 Volume performance (in units) SegmentMar-15Mar-14%chgFeb-15YTD'15YTD'14%chgMotorcycles76,93668,15812.974,292960,602793,48021.1Scooters54,66647,766 14.456,750 -3.7707,537 475,928 48.7Mopeds68,63672,898-5.864,467774,883716,6038.1Total 2-W Sales200,238188,822 6.0195,5092,443,022 1,986,011 23.03-Wheelers10,8848,00436.09,05620.2107,96281,46432.5Total Sales211,122196,826 7.3204,5652,550,984 2,067,475 23.4Exports(incl. in above)42,63729,94442.438,72510.1414,669315,19131.6Exports as % of sales21.315.919.817.015.9Domestice sales157,601158,878-0.8156,7842,028,3531,670,82021.4 Source: Company, Siam HMSI volumes witnessed marginal growth of ~2% YoY to 399,178 units mainly after strong growth in the scooter segment was offset by de-growth in the motorcycle segment Overall motorcycle volumes declined ~18% YoY, led by a sharp drop in sales of “CB Shine” while the scooter segment witnessed growth of ~21% YoY, led by strong growth in all its three brands Dio”, “Activa” and “Aviator”Export sales declined ~17% YoY to 14,751 units. With HMSI’s focus more on the domestic markets, the segment remains a small part of HMSI’s volume pie (~4%) Volume performance (in units) SegmentMar-15Mar-14%chgFeb-15 TD'15 TD'14%chgMotorcycles145,508190,191-23.5139,3341,794,435 1,746,8132.7Scooters238,919202,05718.2208,81114.42,527,094 1,944,93029.9Total Sales399,178392,2481.8361,49310.44,437,926 3,720,60819.3Exports(incl.above)14,75117,834 -17.313,34810.5182,840 163,114 12.1Exports as % of sales45 -85 bps4 -369 bps 4 -26 bpsDomestice sales384,427374,4142.7348,14510.44,255,086 3,557,49419.6 Source: Company, Siam TVS Motors : Sales volumes 100150200250Mar'14May'14Jul'14Sep'14Nov'14Jan'15Mar'15 Motorcycles Scooters MopedsSource: Siam, ICICIdirect.com Research HMSI: Motorcycles & scooter sales volumes Mar'14Nov'14Jan'15Mar'15 Motorcycles ScootersSource: Siam, ICICIdirect.com Research | Retail Equity Research The overall passenger vehicles segment at ~292,387 units witnessed marginal growth of ~0.4% YoY. Domestically, growth has been ~3% YoY with market leaders like MSIL and Hyundai registering volume growth of ~1.4% and ~13%, respectively. Overall, exports for the PV segment at ~47,992 units de-grew ~10% YoY with MSIL and Hyundai’s exports declining ~29% YoY and ~39% YoY, respectively. The utility vehicle (UV) segment volume grew ~9% YoY outperforming the overall PV market. The UV1 sub-segment witnessed 14% YoY growth, mainly driven by domestic sales of Mobilio and export growth of Ecosport. The UV4 segment witnessed growth of ~40% YoY, driven by higher sales of Toyota’s . Volumes of the vans segment witnessed a marginal decline by ~0.2% YoY. The commercial vehicles segment witnessed growth of ~2% YoY. The M&HCV segment grew ~17% YoY to 31,555 units while LCV showed some signs of improvement. However, its volume de-grew 6% YoY to 43,098 units. Market share movement According to Siam, the domestic market share for passenger vehicles cles (CV) in March 2015 has been as follows Domestic market share movement in passenger vehicles 3.205101520253035404550MarutiHyundaiOthers Mar-14 Source: Siam, Data used is YTD * passenger vehicles as per Siam include Vans like Gio, Maxximo, Eeco, Ace MSIL continues to dominate the passenger vehicle segment with market share 45% with the addition of new diesel capacity and outperformance of its petrol portfolio on the back of diesel-petrol price rationalisation | Retail Equity Research Exhibit 12: Market share movement in A2 segment Mar-13Apr-13Aug-13Feb-14Mar-14Apr-14Aug-14Feb-15Mar-15 Hyundai Source: Siam, Top two PV OEMs considered Domestic market share movement in commercial vehicles ALLM&MTata MotorsOthers(%) Mar-15 Source: Siam Data used is YTD Segmental share in CVs Apr-13May-13Jun-13Jul-13Aug-13Sep-13Oct-13Nov-13Dec-13Jan-14Feb-14Mar-14Apr-14May-14Jun-14Jul-14Aug-14Sep-14Oct-14Nov-14Dec-14Jan-15Feb-15Mar-15(%) Source: Siam The A2 segment is the bread and butter category of the passenger car segment. The segment growth has moderated over the last couple of months owing to a lack of options among diesel variants. As discretionary consumption spending increases, the segment is expected to see a definite improvement in volumes The M&HCV segment continued to show traction while the LCV segment has seen some signs of a recovery. The overall growth in the CV segment of ~2% YoY was largely driven by growth in M&HCV, which grew ~17% YoY while LCV volumes declined ~6% YoY The strong volume growth witnessed in the M&HCV segment over the past four months led the LCV/MHCV ratio to stand at 58:42 | Retail Equity Research Maruti Suzuki India (MARUTI) Maruti Suzuki’s overall sales volumes declined ~2% YoY and 6% MoM to 111,555 units. This was mainly after muted domestic demand and a sharp drop in its exports sales Domestic volumes grew marginally by ~1% YoY to 103,719 units. This was mainly after flat growth in its mini car segment (Alto, Wagon R) and ~13% YoY de-growth in its compact car segment (Swift, Ritz, Celerio and Dzire) Export volumes witnessed a sharp decline of 29% YoY to 7,836 units impacting the overall volumes of the company Volume performance (in units) SegmentMar-15Mar-14%chgFeb-15YTD'15YTD'14%chgM800*000NA- 17,103 -100.0Omni, Eeco,Versa11,7689,75220.711,3014.1128,973 102,115 26.3Alto, Wagon-R, Zen, lerio, Dzire78,86985,607-7.982,766-4.7856,630 748,486 14.4SX4, Swift Dzire Tour, Ciaz6,8644111570.17,962-13.8116,901 124,619 -6.2Total Passengers97,50195,7701.8102,029-4.41,102,504 992,324 11.1Gypsy, Vitara,Ertiga6,2186,499-4.35,8636.168,198 61,119 11.6Total Domestic103,719102,2691.4107,892-3.91,170,702 1,053,443 11.1Exports7,83611,081-29.310,659-26.5121,713 101,352 20.1Total Sales111,555113,350-1.6118,551-5.91,292,415 1,154,795 11.9Exports as % of sales 7.09.89.09.48.8 Source: Company, Siam. * estimates Ashok Leyland (ASHLEY) Ashok Leyland’s (ALL) overall volumes have grown handsomely by ~24% YoY. The M&HCV segment continued to show an improvement in volumes (~22% MoM growth, ~30% YoY) while the LCV segment saw volumes at ~2717 units, up ~8% YoY The M&HCV goods segment saw ~33% YoY growth while the M&HCV passenger segment witnessed growth of ~22% YoYOverall exports declined 21% YoY, thereby reducing the overall contribution to ~9% vs. ~14% in March 2014 Volume performance (in units) SegmentMar-15Mar-14%chgFeb-15%chgYTD'15YTD'14%chgM&HCV Passenge r 2,311 1,88922.3 2,189 5.620,722 19,328 7.2 M&HCV G 7,741 5 , 32.8 039 . 2 56,938 40,974 39.0 2,717 2,5257.6 2,509 8.326,904 28,205 -4.6Passenger Vehicles 10 38 25 NA351 782 NATotal Sales 12,779 10,28124.3 10,762 18.7104,915 89,289 17.5Exports 1,122 1,412-20.51,391-19.312,553 5,616 123.5Exports as % of sales8.813.712.912.06.3 Source: Company, Siam Maruti Suzuki India: sales volumes 101113101111110Mar'14May'14Jul'14Sep'14Nov'14Jan'15Mar'15('000s)(%) Total Sales Export % Source: Siam, ICICIdirect.com Research Ashok Leyland: Total sales 7.74.54.95.55.75.86.65.85.27.28.08.210.02.51.31.71.92.12.52.52.52.52.12.62.52.7Mar'14Apr'14May'14Jun'14Jul'14Aug'14Sep'14Oct'14Nov'14Dec'14Jan'15Feb'15Mar'15(000's) Source: Siam, ICICIdirect.com Research | Retail Equity Research Page 10 Mahindra and Mahindra (MAHMAH) M&M’s volumes have underperformed the overall industry. Its core UV segment declined ~12% YoY against the overall UV segment (including exports), which has grown ~9% YoY. However, ex Honda’s “Mobilio” the segment is up ~4% YoY, thus indicating the need for faster launch of new models for the Old warhorses and Scorpio (together contributing ~14,000 units) continued to drive the bulk of volumes, even as newer tain their expected run rates The company’s farm equipment segment has been severely impacted by erratic rains, which damaged crops in northern India. Domestic tractor volumes declined 37% YoY to ~10,392 units. Tractor exports, however, increased 69% YoY, to 1,862 units. We believe tractor volumes would continue to remain under pressure at-least in the near to medium term Volume performance (in units) SegmentMar-15Mar-14%chgFeb-15 TD'15 TD'14%chgUV’s 20,73023,433-11.517,80316.4207,039 229,155-9.74-Wheeler pickups14,27917,649-19.111,92819.7158,957177,587-10.5M & HC V 1,0761,103-2.473147.28,911 8,1619.2Verito+Verito Vibe300500-40.03000.02,982 8,805-66.1Total 4wheeler Sales36,38542,185-13.730,76218.3377,889 414,903-8.93-Wheeler 4,8086,305-23.74,15615.756,764 62,614-9.3Total Domestic Auto Sales41,19348,490-15.034,91818.0434,653 477,517-9.0Exports4,0193,14627.73,11529.030,185 29,6601.8Total Auto Sales45,21251,636-12.438,03318.9464,838 507,177-8.3Exports as % of sales8.96.18.26.55.8Tractors - Domestic10,39216,571-37.310,2671.2220,157 257,270-14.4 - Exports1,8621,10269.01,17059.113,868 10,36433.8Total Tractors12,25417,673-30.711,4377.1234,025 267,634-12.6Exports as % of sales15.26.210.25.93.9 Source: Company, Siam Mahindra and Mahindra: Sales volume 51.636.337.935.635.244.942.834.336.339.945.2Mar'14Apr'14May'14Jun'14Jul'14Aug'14Sep'14Oct'14Nov'14Dec'14Jan'15Feb'15Mar'15(000's) Source: SIAM, ICICIdirect.com Research Mahindra and Mahindra: Tractor sales 20.7Mar'14Apr'14May'14Jun'14Jul'14Aug'14Sep'14Oct'14Nov'14Dec'14Jan'15Feb'15Mar'15(000's)Source: SIAM, ICICIdirect.com Research | Retail Equity Research Page 11 News & views Maruti Suzuki had recalled 19,780 units of the Alto 800 and 13,318 units of the 1000 cc mini car Alto K10 to inspect and replace the right hand door latch assembly manufactured between December 8, 2014 and February Hero MotoCorp’s in a joint venture (JV) with Magneti Marelli, HMC-MM Auto, has inaugurated its production facility to develop new generation fuelling system for two-wheelers Ashok Leyland has divested its 48.5% stake in Ashok Leyland Wind Energy and 100% stake in Avia Ashok Leyland Motors, which is in line with the company’s plans to focus on its core business and reduce overall debt from its books | Retail Equity Research Page 12 ICICIdirect.com Research Universe (Auto & Auto ancillary) CMPM Cap(|)TP(|)Rating(| Cr)FY15EFY16EFY17EFY15EFY16EFY17EFY15EFY16EFY17EFY15EFY16EFY17EFY15EFY16EFY17EAmara Raja (AMARAJ)830932Hold14,17625.134.042.333.124.419.620.916.513.133.934.033.025.026.425.6Apollo Tyre (APOTYR)175228Buy8,80919.521.422.88.98.27.75.55.55.319.316.615.317.916.515.1Ashok Leyland (ASHLEY)7068Hold19,8031.22.13.556.733.320.221.915.311.66.711.014.96.610.816.0Bajaj Auto (BAAUTO)1,9912,833Buy57,615111.8155.5180.017.812.811.111.89.17.338.039.440.429.934.833.7Balkrishna Ind. (BALIND)763750Buy7,37248.052.762.513.812.510.68.67.46.115.616.419.220.015.616.4Bharat Forge (BHAFOR)1,1721,178Hold27,30233.943.352.934.527.022.216.513.611.525.225.826.724.525.025.1Bosch (MICO)23,64924,000Hold74,258341.2463.0600.073.053.841.549.636.227.915.017.519.115.718.821.2Eicher Motors (EICMOT)14,74718,800Buy39,832228.0393.8703.964.737.421.040.725.514.623.931.038.624.230.836.8Escorts (ESCORT)133131Hold1,5896.912.922.418.59.85.79.06.63.75.38.112.74.37.611.8Exide Industries (EXIIND)177220Buy15,0836.08.411.429.421.115.618.814.010.417.821.925.812.715.818.6Hero Mototcorp (HERHON)2,3913,036Hold47,739128.8166.2202.418.614.411.814.616.315.146.852.552.439.442.842.8JK Tyre & Ind (JKIND)118171Buy2,67115.222.926.37.75.24.55.34.13.419.922.824.126.730.928.1M&M (MAHMAH)1,1991,457Buy70,77153.267.883.822.517.714.315.89.47.514.918.220.718.118.219.3Mahindra CIE (MAHAUT)198260Buy6,3975.39.913.237.320.115.013.510.18.26.912.615.76.911.415.3Maruti Suzuki (MARUTI)3494.53999.8Hold105602.3117155.120029.922.517.516.513.010.214.717.419.614.816.918.6Motherson (MOTSUM)479512Buy422219.116.927.352.628.317.514.510.77.322.227.635.824.836.341.6Wabco India (WABTVS)5578.25999.6Buy1059867.2117.8166.783.047.333.547.031.122.114.720.923.218.524.327.6Sector / CompanyEPS (|)P/E (x)EV/EBITDA (x)RoCE (%) Source: ICICIdirect.com Research *Year ending September | Retail Equity Research Page 13 Exhibit 18: Auto raw material index RM Auto Index 100120140160180200220240Feb-09May-09Aug-09Nov-09Feb-10May-10Aug-10Nov-10Feb-11May-11Aug-11Nov-11Feb-12May-12Aug-12Nov-12Feb-13May-13Aug-13Nov-13Feb-14May-14Aug-14Nov-14Feb-15 Source: Bloomberg, Reuters, Company, ICICIdirect.com Research Currency movements 100110120130140150160Jun-11Sep-11Dec-11Mar-12Jun-12Sep-12Dec-12Mar-13Jun-13Sep-13Dec-13Mar-14Jun-14Sep-14Dec-14Mar-15 US$INR US$JPY US$EUR Volatility in the currency markets is impacting raw material prices for companies with imported components and lower natural hedges. Source: Company, ICICIdirect.com Research The in-house raw material index reflects the combination of various input materials (steel, rubber, aluminium, plastics) for OEMs, which have February 2009 as base year at 100. The chart shows a declining trend in raw material prices, | Retail Equity Research Page 14 ICICIdirect.com endeavours to provide objective opinions and recommendations. ICICIdirect.com assigns ratings to its stocks according to their notional target price vs. current market price and then categorises them as Strong Buy, Buy, Hold and Sell. The performance horizon is two years unless specified and the notional target price is defined as the analysts' valuation for a stock. Sector view: Over weight compared to index Under weight compared to index Index here refers to BSE 500 Head – Researchpankaj.pandey@icicisecurities.comICICIdirect.com Research Desk, ICICI Securities Limited, Road No 7, MIDC, Mumbai – 400 093 research@icicidirect.com | Retail Equity Research Page 15 ANALYST CERTIFICATION We /I, Nishit Zota, MBA (Finance) and Vidrum Mehta, MBA (Finance) research analysts, authors and the names subscribed to this report, hereby certify that all of the views expressed in this research report accurately reflect our views about the subject issuer(s) or securities. We also certify that no part of our compensation was, is, or will be directly or indirectly related to the specific recommendation(s) or view(s) in this report. Terms & conditions and other disclosures: ICICI Securities Limited (ICICI Securities) is a full-service, integrated investment banking and is, inter alia, engaged in the business of stock brokering and distribution of financial products. ICICI Securities is a wholly-owned subsidiary of ICICI Bank which is India’s largest private sector bank and has its various subsidiaries engaged in businesses of housing finance, asset management, life insurance, general insurance, venture capital fund management, etc. (“associates”), the details in respect of which are available on www.icicibank.com. ICICI Securities is one of the leading merchant bankers/ underwriters of securities and participate in virtually all securities trading markets in India. We and our associates might have investment banking and other business relationship with a significant percentage of companies covered by our Investment Research Department. ICICI Securities generally prohibits its analysts, persons reporting to analysts and their relatives from maintaining a financial interest in the securities or derivatives of any companies that the analysts cover. The information and opinions in this report have been prepared by ICICI Securities and are subject to change without any notice. The report and information contained herein is strictly confidential and meant solely for the selected recipient and may not be altered in any way, transmitted to, copied or distributed, in part or in whole, to any other person or to the media or reproduced in any form, without prior written consent of ICICI Securities. While we would endeavour to update the information herein on a reasonable basis, ICICI Securities is is under no obligation to update or keep the information current. Also, there may be regulatory, compliance or other reasons that may prevent ICICI Securities from doing so. Non-rated securities indicate that rating on a particular security has been suspended temporarily and such suspension is in compliance with applicable regulations and/or ICICI Securities policies, in circumstances where ICICI Securities might be acting in an advisory capacity to this company, or in certain other circumstances. This report is based on information obtained from public sources and sources believed to be reliable, but no independent verification has been made nor is its accuracy or completeness guaranteed. This informational purpose and shall not be used or considered as an offer document or solicitation of offer to buy or sell or subscribe for securities or other financial instruments. Though disseminated to all the customers simultaneously, not all customers may receive this report at the same time. ICICI Securities will not treat recipients as customers by virtue of their receiving this report. Nothing in this report constitutes investment, legal, accounting and tax advice or a representation that any investment or strategy is suitable or appropriate to your specific circumstances. The securities discussed and opinions expressed in this report may not be suitable for all investors, who must make their own investment decisions, based on their own investment objectives, financial positions and needs of specific recipient. This may not be taken in substitution for the exercise of independent judgment by any recipient. The recipient should independently evaluate the investment risks. The value and return on investment may vary because of changes in interest rates, foreign exchange rates or any other reason. ICICI Securities accepts no liabilities whatsoever for any loss or damage of any kind arising out of the use of this report. Past performance is not necessarily a guide to future performance. Investors are advised to see Risk Disclosure Document to understand the risks associated before investing in the securities markets. Actual results may differ materially from those set forth in projections. Forward-looking statements are not predictions and may be subject to change without notice. ICICI Securities or its associates might have managed or co-managed public offering of securities for the subject company or might have been mandated by the subject company for any other assignment in the past twelve months. ICICI Securities or its associates might have received any compensation from the companies mentioned in the report during the period preceding twelve months from the date of this report for services in respect of managing or co-managing public offerings, corporate finance, investment banking or merchant banking, brokerage servmerger or specific transaction. ICICI Securities or its associates might have received any compensation for products or services other than investment banking or merchant banking or brokerage services from the companies mentioned in the report in the past twelve months. ICICI Securities encourages independence in research report preparation and strives to minimize conflict in preparation of research report. ICICI Securities or its analysts did not receive any compensation or other benefits from the companies mentioned in the report or third party in connection with preparation of the research report. Accordingly, neither ICICI Securities nor Research Analysts have any material conflict of interest at the time of publication of this report. It is confirmed that Nishit Zota, MBA(Finance) and Vidrum Mehta, MBA(Finance) research analysts of this report have not received any compensation from the companies mentioned in the report in the Compensation of our Research Analysts is not based on any specific merchant banking, investment banking or brokerage service trICICI Securities or its subsidiaries collectively or Research Analysts do not own 1% or more of the equity securities of the Company mentioned in the report as of the last day of the month preceding the publication of the research report. Since associates of ICICI Securities are engaged in various financial service businesses, they might have financial interests or beneficial ownership in various companies including the subject company/companies mentioned in this report. It is confirmed that Nishit Zota, MBA(Finance) and Vidrum Mehta, MBA(Finance) research analysts do not serve as an officer, director or employee of the companies mentioned in the report. ICICI Securities may have issued other reports that are inconsistent with and reach different conclusion from the information presented in this report. Neither the Research Analysts nor ICICI Securities have been engaged in market making activity for the companies mentioned in the report. We submit that no material disciplinary action has been taken on ICICI Securities by any Regulatory Authority impacting Equity Research Analysis activities. This report is not directed or intended for distribution to, or use by, any person or entity who is a citizen or resident of or located in any locality, state, country or other jurisdiction, where such distribution, publication, availability or use would be contrary to law, regulation or which would subject ICICI Securities and affiliates to any registration or licensing requirement within such jurisdiction. The securities described herein may or may not be eligible for sale in all jurisdictions or to certain category of investors. Persons in whose possession this document may come are required to inform themselves of and to observe such restriction. Retail Equity Research Page 12 ICICIdirect.com Research Universe (Auto & Auto ancillary) CMPM Cap(|)TP(|)Rating(| Cr)FY15EFY16EFY17EFY15EFY16EFY17EFY15EFY16EFY17EFY15EFY16EFY17EFY15EFY16EFY17EAmara Raja (AMARAJ)830932Hold14,17625.134.042.333.124.419.620.916.513.133.934.033.025.026.425.6Apollo Tyre (APOTYR)175228Buy8,80919.521.422.88.98.27.75.55.55.319.316.615.317.916.515.1Ashok Leyland (ASHLEY)7068Hold19,8031.22.13.556.733.320.221.915.311.66.711.014.96.610.816.0Bajaj Auto (BAAUTO)1,9912,833Buy57,615111.8155.5180.017.812.811.111.89.17.338.039.440.429.934.833.7Balkrishna Ind. (BALIND)763750Buy7,37248.052.762.513.812.510.68.67.46.115.616.419.220.015.616.4Bharat Forge (BHAFOR)1,1721,178Hold27,30233.943.352.934.527.022.216.513.611.525.225.826.724.525.025.1Bosch (MICO)23,64924,000Hold74,258341.2463.0600.073.053.841.549.636.227.915.017.519.115.718.821.2Eicher Motors (EICMOT)14,74718,800Buy39,832228.0393.8703.964.737.421.040.725.514.623.931.038.624.230.836.8Escorts (ESCORT)133131Hold1,5896.912.922.418.59.85.79.06.63.75.38.112.74.37.611.8Exide Industries (EXIIND)177220Buy15,0836.08.411.429.421.115.618.814.010.417.821.925.812.715.818.6Hero Mototcorp (HERHON)2,3913,036Hold47,739128.8166.2202.418.614.411.814.616.315.146.852.552.439.442.842.8JK Tyre & Ind (JKIND)118171Buy2,67115.222.926.37.75.24.55.34.13.419.922.824.126.730.928.1M&M (MAHMAH)1,1991,457Buy70,77153.267.883.822.517.714.315.89.47.514.918.220.718.118.219.3Mahindra CIE (MAHAUT)198260Buy6,3975.39.913.237.320.115.013.510.18.26.912.615.76.911.415.3Maruti Suzuki (MARUTI)3494.53999.8Hold105602.3117155.120029.922.517.516.513.010.214.717.419.614.816.918.6Motherson (MOTSUM)479512Buy422219.116.927.352.628.317.514.510.77.322.227.635.824.836.341.6Wabco India (WABTVS)5578.25999.6Buy1059867.2117.8166.783.047.333.547.031.122.114.720.923.218.524.327.6Sector / CompanyEPS (|)P/E (x)EV/EBITDA (x)RoCE (%) Source: ICICIdirect.com Research *Year ending September Retail Equity Research Page 14 ICICIdirect.com endeavours to provide objective opinions and recommendations. ICICIdirect.com assigns r notional target price vs. current market price and then categorises them as Strong Buy, Buy, Hold and Sell. The performance horizon is two years unless specified and the notional target price is defined as the analysts' valuation for a stock. Sector view: Over weight compared to index Under weight compared to index Index here refers to BSE 500 Head – Researchpankaj.pandey@icicisecurities.comICICIdirect.com Research Desk, ICICI Securities Limited, Road No 7, MIDC, Mumbai – 400 093 research@icicidirect.com