/
Performance evaluation of blended coconut oil and fish oil on Performance evaluation of blended coconut oil and fish oil on

Performance evaluation of blended coconut oil and fish oil on - PowerPoint Presentation

tatiana-dople
tatiana-dople . @tatiana-dople
Follow
342 views
Uploaded On 2019-11-21

Performance evaluation of blended coconut oil and fish oil on - PPT Presentation

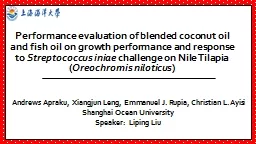
Performance evaluation of blended coconut oil and fish oil on growth performance and response to S treptococcus iniae challenge on Nile Tilapia Oreochromis niloticus Andrews Apraku Xiangjun ID: 766580

total diet fish 00

Share:

Link:

Embed:

Download Presentation from below link

Download Presentation The PPT/PDF document "Performance evaluation of blended coconu..." is the property of its rightful owner. Permission is granted to download and print the materials on this web site for personal, non-commercial use only, and to display it on your personal computer provided you do not modify the materials and that you retain all copyright notices contained in the materials. By downloading content from our website, you accept the terms of this agreement.


Presentation Transcript

Performance evaluation of blended coconut oil and fish oil on growth performance and response to Streptococcus iniae challenge on Nile Tilapia (Oreochromis niloticus) Andrews Apraku, Xiangjun Leng , Emmanuel J. Rupia , Christian L. Ayisi Shanghai Ocean University Speaker: Liping Liu

ContentsIntroductionObjectivesMaterials and methodsResultsDiscussionConclusion

IntroductionsxlnkcnakcnAlternative sources ~8.9MT -2020Nutrition >50% Plants / vegetables High cost Low production Diseases 85% FO produced overfishing Antibiotics ban Meeting demand Naylor et al., 2000; FAO,2007,2014,2010; Tacon, 1993, Venega-calerion et al., 2010; De- silva et al., 2004

Coconut oilAccounts for 20% of world vegetable oil - [CRB Fundamentals, 2008]High SFA’S,92%; Low MSFA and PUFA of 6% and 2% respectively- [Applewhite, 1994] C10:0 and C18:0 act as energetic substrate – [Benevenga, 1989; Alice et al., 2006].Higher lauric acid- antibacterial, antiprotozoal and antiviral properties – [Ogbolu et al., 2007]High resistance to oxidative reactionStable under warm temperatures (stable) – [Alice et al., 2006]

Coconut oilC12 is absorbed easily - [Olsen et al., 1993]Improve LC-PUFA retention and restoration in feeds – [Trusheuski et al., 2008, 2009]It gives diet flavor – [Bozzolo et al., 1993] price: 29 cents per pounds in 2006 – [CRB Fundamentals, 2008] - [US Department of Agriculture, 2011] Year 2005-06 2006-07 2007-8 2008-09 2009-10 2010-11 Production/Million tonnes5.915.425.795.626.606.24

ObjectivesEvaluate the effect on dietary levels on growth performance and feed utilizationEvaluate the effects of dietary lipid levels on body composition and fatty acid profile of Nile tilapia, Oreochromis niloticusEvaluate the effects of dietary lipid levels on blood metabolites of Nile tilapia, Oreochromis niloticus

Materials and methods Ingredients (g 100g -1 ) Experimental groups Diet A Diet B Diet C Diet D Diet E Fish meal 10.00 10.00 10.00 10.00 10.00 Soybean meal 20.00 20.00 20.00 20.00 20.00 Wheat bran 20.00 20.00 20.00 20.00 20.00 Rape seed meal 24.26 24.26 24.26 24.26 24.26 Wheat Middling 20.00 20.00 20.00 20.00 20.00 Fish oil (FO) 3.00 2.25 1.50 0.75 0.00 Virgin coconut oil (VCO) 0.00 0.75 1.50 2.25 3.00 Vitamin and Mineral mix 0.650.650.650.650.65Vitamin C0.050.050.050.050.05Choline Chloride0.500.500.500.500.50Inositol0.040.040.040.040.04Ca(H2PO4)1.501.501.501.501.50Total100.00100.00100.00100.00100.00 Table 1: Proximate composition of ingredients (%DM) in experimental diets with different added lipid sources. FO/VCO=100%(Diet A), 3:1 (Diet B), 1:1 (Diet C), 1:3(Diet D), 0%(Diet E).

Materials and methodsFeeding trial

Materials and methodsMeasurementsWeight and length: 15 fish/15th day Termination point: All experimental fishFeed: amount fed to fish calculated dailyAmmonia and nitrite measured as well on weekly basis - [APHA, 1998]Dissolved oxygen (DO) concentration, pH, and water temperature monitored on daily basis with appropriate instrument and methods.

Materials and methodsSampling and analytical methods [Folch et al., 1957] [AOAC, 1995]

Materials and methodsBacteria challenge [Yildrim et al., 2003]

Data analysis and statisticsSGR (%) = (ln final weight – ln initial weight / number of days *100 WG (%) = (final body weight – initial body weight / initial body weight) * 100K = Body weight (g) / total length (cm)3 *100FCR = Feed intake (g) / Weight gain (g) FI = Total feed consumed (g) during the 56 days trial.SR = Total number of fish stocked / Total number at the end of the feeding trial

Data analysis and statisticsFCR = 100 ((ln initial fat content of fish – ln final fat content of fish)/ TPER = Weight gain (g) / Protein intake (g)HSI = Liver weight (g) / Whole body weight (g) * 100Data was analysed by one-way analysis of Variance (ANOVA) to test the effects of the five experimental diets. Statistical analysis was made using graph Pad prism 5.1 . All data were presented as mean ± SEM.

FATTY ACID(S)   Diet A Diet B Diet C Diet D Diet E 12:0 0.23±0.04 a 5.51±2.79 ab 14.87±0.41 bc 19.64±0.36 c 20.97±5.60 c 14:0 3.63±0.13 a 5.56±0.23 ab 6.84±0.04 ab 8.31±0.05 b 8.65±1.10 b Total SFA’s 21.90±8.12 25.64±4.54 38.01±2.70 49.37±1.51 53.17±9.37 18:1(n-9) 19.98±7.53 19.11±6.26 21.65±0.70 13.91±4.50 10.71±3.92 TOTAL 38.42±13.99 37.65±13.50 30.60±1.18 25.44±9.59 21.62±10.58 MUFAs           18:2(n-6) 25.22±2.38 25.96±0.81 24.14±0.7620.87±0.2623.12±5.0120:4(n-6)ARA0.49±0.06a0.19±0.10ab0.16±0.08b 0.11±0.03b 0.04±0.02 b Total n-6 25.73±2.45 26.15±0.91 24.34±0.86 20.98±0.29 23.16±5.03 18:3(n-3) 0.46±0.12 a 0.27±0.03 ab 0.27±0.06 ab 0.27±0.05 ab 0.11±0.05 b 20:5(n-3)EPA 4.18±0.40 a 3.56±0.07 a 2.40±0.05 c 1.57±0.05 b 0.85±0.01 b 22:6(n-3)DHA 7.35±0.81b5.22±0.17b3.35±0.07b1.87±0.07a0.87±0.06aTotal n-313.25±1.87a10.19±0.75b6.45±0.22c3.98±0.18d1.98±0.16eTotal PUFAs39.13±4.37b36.46±1.72b30.92±1.09b25.07±0.48a25.21±5.20aTotal LC-PUFAs12.53±1.73a9.63±0.76b6.34±0.24c3.82±0.16d1.87±0.10eTotal MC-PUFAs26.45±2.60a26.71±0.90a24.45±0.84b21.14±0.31c23.27±5.19bn-3:n-60.52±0.76a0.39±0.82ab0.27±0.26bc0.19±0.62cd0.09±0.03d Fatty acid (FA) composition (% total FA) of experimental diets Results

Results

Results

ResultsMajor nutrient composition of moisture, crude lipid, protein and ash content of whole body and muscle of Nile tilapia fed different diets for 8 weeks  Diet A Diet B Diet C Diet D Diet E Initial whole body Final whole body Moisture 10.75±1.20 11.40±1.45 11.21±0.90 11.18±1.20 11.07±0.31 11.09±0.58 Protein 63.30±1.42 58.40±0.87 59.69±0.33 61.00±1.60 62.61±2.46 64.06±1.48 Lipid 7.04±0.32 bc 2.74±0.90 a 3.26±0.33 a 4.67±0.59 ab 7.44±0.36 c 6.62±0.15 bc Ash 0.28±0.00 d 0.80±0.01 a 0.73±0.01 b 0.72±0.00 b 0.78±001 ac 0.72±0.01 bc MUSCLE Moisture   10.45±0.15 a 10.52±0.86 a 10.42±0.48a10.69±0.18ab10.90±0.90bProtein 94.33±0.41a95.85±0.20ab96.47±0.32b95.63±0.60ab96.48±0.26bLipid 2.22±0.22a1.77±0.18ab1.15±0.04bc1.07±0.17bc 0.90±0.13c Ash   0.28±0.00 ab 0.26±0.00 ab 0.27±0.00 ab 0.25±0.02 a 0.29±0.00 b

Results FATTY ACID(S)   Diet A Diet B Diet C Diet D Diet E 12:0 0.000±0.00 c 2.40±0.07 b 5.27±0.46 b 7.39±0.59 a 8.93±0.65 a 14:0 3.68±0.07 a 4.18±0.43 a 6.44±0.31 c 7.61±0.35 b 8.67±0.31 b Total SFA’s 38.59±0.46 a 39.64±0.83 a 44.61±1.62 b 46.14±1.87 b 48.61±1.74 b 18:1(n-9) 30.60±0.32 a 30.02±0.35 ab 28.79±0.73 abc 27.64±0.43 c 26.91±0.47 bc TOTAL MUFAs 41.89±2.91 b 39.68±0.51b39.00±1.25b36.30±1.42a35.35±1.67a 18:2(n-6)16.11±0.39ab18.25±0.20a15.22±1.00ab16.40±0.90ab14.39±0.59b20:4(n-6)ARA0.11±0.060.17±0.060.14±0.050.08±0.050.16±0.14Total n-616.22±0.4518.42±0.2615.39±1.0816.48±0.9514.55±0.7318:3(n-3)0.27±0.120.12±0.020.19±0.060.18±0.040.11±0.0920:5(n-3)EPA0.13±0.100.10±0.020.12±0.080.18±0.05 0.13±0.05 22:6(n-3)DHA 2.03±0.06 b 1.28±0.03 b 0.94±0.03 b 0.50±0.06 a 0.40±0.03 a Total n-3 3.17±0.55 c 2.18±0.32 a 1.66±0.11 ab 1.01±0.22 b 1.04±0.34 b Total PUFAs 19.39±1.0 a 20.60±0.58 a 17.05±1.19 b 17.49±1.17 b 15.59±1.07cTotal LC-PUFAs2.91±0.39a1.96±0.23ab1.58±0.19ab0.85±0.19b0.99±0.33bTotal MC-PUFAs16.48±0.55a18.64±0.35c15.47±1.09ab16.64±0.98a14.60±0.74bn-3:n-60.20±1.22a0.12±1.23ab0.12±0.10ab0.06±0.23b0.07±0.47bFatty acid (%area) of whole body of tilapia fed diets of elevated VCO levels for 8 weeks

Results FATTY ACID(S)   Diet A Diet B Diet C Diet D Diet E 12:0 0.00±0.00 a 1.44±0.43 ab 2.81±0.05 ab 6.03±1.28 bc 7.61±1.86 c 14:0 2.48±0.14 a 2.70±0.19 a 3.97±0.37 ab 4.78±1.09 ab 6.26±1.11 b Total SFA’s 40.56±1.36 a 46.27±1.90 ab 52.33±1.46 bc 50.00±4.07 bc 53.20±4.80 c 18:1(n-9) 22.71±0.68 ab 22.00±0.28 ab 21.65±0.18 ab 23.24±0.77 a 20.93±0.25 b TOTAL MUFAs 31.86±1.82 abc 29.15±0.61a29.06±0.85b30.11±1.69c27.99±0.62c18:2(n-6)13.31±0.15ab14.81±0.71b10.92±0.14a13.90±0.60b13.24±0.70ab20:4(n-6)ARA1.93±0.331.37±0.301.08±0.171.52±0.620.11±0.23Total n-615.47±0.6216.18±1.0112.00±0.3115.42±1.2213.35±0.9318:3(n-3)0.15±0.060.18±0.130.16±0.090.55±0.140.37±0.0320:5(n-3)EPA0.06±0.060.02±0.020.03±0.020.06±0.030.08±0.01 22:5(n-3) 1.52±0.65 b 0.00±0.00 a 0.00±0.00 a 0.00±0.00 a 0.00±0.00 a 22:6(n-3)DHA 9.02±0.14 d 6.53±0.23 a 5.04±0.69 ab 2.31±0.38 c 3.14±0.54 bc Total n-3 12.37±1.34 b 8.05±0.61 b 6.55±1.01 b 3.42±0.82 a 4.42±0.70 aTotal PUFAs27.84±1.96b24.23±1.62b18.55±1.32a18.84±2.04a17.77±1.63aTotal LC-PUFAs14.38±1.75b9.24±0.78b7.47±1.09b4.39±1.30a4.16±0.90aTotal MC-PUFAs13.46±0.21a14.99±0.84a11.08±0.23b14.45±0.74a13.61±0.73an-3:n-60.70±2.16c0.50±0.60a0.55±3.26a0.22±0.67b0.33±0.75bFatty acid composition of muscle (% area) of tilapia fed different diets for 8 weeks

Results FATTY ACID(S)   Diet A Diet B Diet C Diet D Diet E 12:0 0.00±0.00 a 0.34±0.17 a 3.02±0.76 b 4.15±0.89 bc 6.30±0.21 c 14:0 3.32±0.24 4.59±0.15 6.05±0.10 a 6.64±0.28 a 8.32±0.08 Total SFA’s 39.23±4.03 b 50.10±3.52 b 52.04±1.53 a 48.85±6.80 b 52.59±5.27 a 18:1(n-9) 27.41±0.29 b 31.38±1.72 ab 29.58±1.13 ab 33.08±0.92 a 26.52±0.74 b TOTAL 39.61±1.13 ab 40.84±2.89 a 37.421.95 c 40.65±2.00b33.39±2.29dMUFAs     18:2(n-6)11.45±1.269.27±0.787.15±0.078.82±1.969.36±0.4520:4(n-6)ARA0.08±0.080.19±0.190.00±0.000.00±0.000.49±0.49Total n-611.53±1.349.46±0.977.15±0.078.82±1.9610.24±1.3320:5(n-3)EPA0.16±0.16a3.06±1.17b0.07±0.07a0.00±0.00a0.08±0.08a 22:6(n-3)DHA 6.25±0.38 c 1.05±0.39 b 3.20±0.27 a 1.06±0.12 b 2.48±0.78 ab Total n-3 8.49±1.26 c 5.17±1.61 c 3.67±0.55 a 1.60±0.12 b 2.88±1.18 ab Total PUFAs 20.83±3.11 a 14.63±2.58 c 10.82±0.62 b 10.42±2.08 ab 13.12±2.51 cTotal LC-PUFAs8.41±1.18c5.36±1.80c03.42±0.42a1.60±0.12b2.88±1.18abTotal MC-PUFAs11.61±1.42c9.27±0.78b7.40±0.20a8.82±1.96ab9.36±0.45bn-3:n-60.74±0.94 c0.55±1.66a0.51±7.86a0.18±0.06b0.28±0.89bLiver fatty acid composition of O. niloticus fed elevated levels VCO for 8 weeks

Results Parameters/Lipid sources Diet A Diet B Diet C Diet D Diet E HDL- Cholesterol 2.85±0.12 a 2.04±0.30 b 2.60±0.10 ab 2.35±0.07 ab 2.51±0.10 ab LDL- Cholesterol 0.43±0.03 0.32±0.06 0.27±0.02 0.38±0.04 0.51±0.09 HDL-C/LDL-C 6.63±4.00 a 6.38±5.00 ab 9.63±5.00 c 6.18±1.75 ab 4.92±1.11 b Plasma metabolites O. niloticus fed on elevated levels of VCO for 8 weeks

ResultsPlasma Metabolites

Results Lipid sources Diet A Diet B Diet C Diet D Diet E Mortality 53.33±0.67 40.0±2.31 33.33±1.33 46.67±1.76 26.67±1.76 Mortality (%) of O. niloticus 16 day post S. iniae challenge

Discussion>WG, FW and FI in VCO: (Ng et al., 2013; Aderolu & Akinremi, 2009;Pie et al., 2004 . ) Good growth performance: ( Yildrim-Aksoy et al., 2007) MUFA’s in VCO sparing protein for tissue growth: ( Eckarstein et al., 2002)FA composition of fish depends on FA profile of diets: (Luo et al., 2004. ) Varying differences in SFA’s: ( Trushenski et al., 2008; 2009 .)

DiscussionSignificant TG: ( Vegusdal et al., 2005; Yildrim-Aksoy et al., 2013.) <Plasma cholesterol: Agree- Richard et al., 2006. <LDL-C: Agree- Nevin & Rajamohan , 2004. Mortality in group A and C: Agree – Kiron et al., 1995>Survival in fish fed diet E: Agree – Ogbolu et al., 2007; Fracalossi & Lovell, 1994; Eckarstein et al., 2002; Manisha et al., 2011.

ConclusionVCO did not impair growth, feed utilization and body compositionDiets were accepted indicating the suitability of lipid at 3% inclusionsDiet E exhibited the best performance showing the importance of n-6 to freshwater fishesdecrease in muscle lipid of fish fed increasing levels of VCO, and increase in the crude protein of whole body and the muscle. This indicates better utilization of protein for growth as evident in the results obtained for PER. Plasma metabolites were not impaired by alternative lipid VCO has potential to replace FO in diets for tilapia Recommended to countries which has high productions in CO to use as lipid fish diets.

AcknowledgementThis study received financial support through the EU- FP7 project “Sustaining Ethical Aquaculture Trade” (SEAT), Shanghai Science & Technology Committee through program No. 13320502200.the Aquaculture and Fisheries Collaborative Research Support Program (AquaFish CRSP) through Oregon State University and Michigan University,

Thank you!