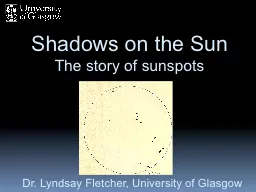
/
What do sunspots tell us about recent and past trends in so What do sunspots tell us about recent and past trends in so

What do sunspots tell us about recent and past trends in so - PowerPoint Presentation

tatiana-dople
tatiana-dople . @tatiana-dople
Follow
413 views
Uploaded On 2017-06-29

What do sunspots tell us about recent and past trends in so - PPT Presentation

Frédéric Clette amp Laure Lefèvre Royal Observatory of Belgium WDC SILSO ESWW11 Nov 2014 SN and GN recalibration early preview 21112014 ESWW11 Nov 2014 2 ID: 564567

nov 2014 cycle esww11 2014 nov esww11 cycle sunspot solar spots dpd small cycles 2013 spot ratio stara number

Share:

Link:

Embed:

Download Presentation from below link

Download Presentation The PPT/PDF document "What do sunspots tell us about recent an..." is the property of its rightful owner. Permission is granted to download and print the materials on this web site for personal, non-commercial use only, and to display it on your personal computer provided you do not modify the materials and that you retain all copyright notices contained in the materials. By downloading content from our website, you accept the terms of this agreement.


Presentation Transcript

Slide1

What do sunspots tell us about recent and past trends in solar activity ?

Frédéric Clette & Laure Lefèvre Royal Observatory of BelgiumWDC - SILSO

ESWW11 – Nov 2014Slide2

SN and GN recalibration:

early preview21/11/2014ESWW11 – Nov. 2014

2

Ongoing

revision

of inhomogeneities in the

Sunspot

Number

(WDC-SILSO)

and Group

Number

series

(

Hoyt

&

Schatten

1994, 1998)

SN Workshops, 2011-2015Slide3

SN and GN

recalibration: early preview

21/11/2014

ESWW11 – Nov. 2014

3

RGO trend

SN

weighting

RGO/

SOON

Specola

drift

Clette

,

Svalgaard

, Vaquero, Cliver, 2014

Space

Science

Reviews

,

Aug. 2014, Springer Online First , 69 pagesDOI 10.1007/s11214-014-0074-2Arxiv: http://arxiv.org/abs/1407.3231

4 main corrections

10 to 40%

Obtained independently

Based only on sunspot data

SN and GN agree within uncertainties back to the Dalton MinimumSlide4

Implications: low secular trends

21/11/2014ESWW11 – Nov. 2014

4

Corrected

SN & GN

series

agree

Secular

trend

is

largely

eliminated

< 5% /

century

Trend +15%/

century

Trend +40%/

century

SN correction:

SN /1.20

after

1947

GN correction:

GN * 1.37

before

1880

Soon after the Maunder Minimum, solar activity was similar to present levelsSlide5

21/11/2014

ESWW11 – Nov. 20145

Open solar

flux

(geomagnetic indices)

Similar conclusions: recent open magnetic field reconstructions show

only a weak

trend over last 180 years

(Lockwood, Living Reviews SP, 9/2013)Slide6

New SN series (red):

correction of SN scale drifts due to the Locarno pilot station

Changes in cycle 22

Implications: recent cycles

21/11/2014

ESWW11 – Nov. 2014

6

Cycle 22

Slightly

decreased (- 5 to10

%)

Maximum 22

second peak is higher, almost equal to first

peakSlide7

Changes in cycle 23

Implications: recent cycles

21/11/2014

ESWW11 – Nov. 2014

7

Cycle 23

Slightly increased (+ 5 to 10

%)

Maximum 23

second

peak becomes higher than the first peak.

Cycle 23 decline raised

by about

20

%

New maximum in 2002 instead of 2000Slide8

Implications: recent cycles

Still

significant disagreement during the decline of cycle 23

Indication of a real solar change

21/11/2014

ESWW11 – Nov. 2014

8

New SN series (red):

correction of SN scale drifts due to the Locarno pilot station

Deviation between

R

i

and F

10.7

in cycle 23Slide9

Implications: a variable number of spots/group (SN/GN ratio)

Reconstructed GN series (SILSO, SONNE):Both indices SN and GN calculated from the same data set

Changing

SN/GN

ratio :

Stable over cycles 19 to 22

Decline in cycle 23 and 24

Decrease of the average number of spots per group by ~30%

21/11/2014

ESWW11 – Nov. 2014

9

SONNE SSN

Locarno SSNSlide10

SN

and GN

contain

a

different

information about the

solar

cycle

A probe for

past

changes in the

solar

dynamo

?

Implications: a variable number of spots/group (SN/GN ratio)

10

21/11/2014

ESWW11 – Nov. 2014

Tlatov 2013

Apparent

secular

variations of the

ratio SN/GN

(

Tlatov

2013)

:

NS/NG increase for stronger cycles ?Ratio of the original SN/GN series: different sets of observations. Slide11

Vanishing small spots

21/11/2014ESWW11 – Nov. 2014

11Slide12

Cycle 23 small-spot deficit

Exploitation of detailed sunspot catalogs: DPD, Debrecen; NOAA/SOON (Lefèvre &

Clette

2011, 2012, 2013)

Scale-dependent small-spot deficit in cycle 23

:

Deficit of small groups (A & B types):

Ratio cycle 23 / cycle 22 ~ 50%

Deficit of small spots inside all groups:

Ratio cycle 23 / cycle 22 < 75%

Starts in 1998, significant only after 2000

21/11/2014

ESWW11 – Nov. 2014

Small vs Large groups

Clette & Lefèvre 2012

12

Small vs Large spotsSlide13

Cycle 23 small

-spot deficit

ESWW11 – Nov. 2014

Similar size-dependent trends found by

Kilcik

et al. 2013

:

U

pgrade of

Kilcik

et al. 2011 results

Based on

Learmonth

data

Small spots

A,B types: factor ~2 deficit Intermediate C type:

moderate decreaseLarge D,E,F,H groups: no difference between SC23 and 24.

A,BC

D,E,F

H_____ Sunspot counts

--------- Sunspot group counts_____ International SN Ri

21/11/201413Slide14

Similar results from

Nagovitsyn et al. 20134 classes based on their area (multimodal distribution)Only the smallest spots (A<17 msh) show a decline in SC23

Number of largest spots increases

Intermediate sizes: no change

Cycle 23

small

-spot

deficit

ESWW11 – Nov. 2014

21/11/2014

14

SS: small < 17

msh

SL: 17

msh

<S<58

msh

LS: 58

msh

<S<174 mshLL: > 174

mshSlide15

New catalog validation

21/11/2014ESWW11 – Nov. 2014

15Slide16

Sunspot catalog cross-validation

Need to assess the homogeneity of the primary DPD sunspot catalog:Several data sources: ground based

stations (80

% in Hungary)

Resolution

: 1 to 2”/pixel

(instrument,

seeing)Sunspot groups and individual

sunspots (unique identification)

Cross-analysis with the

new STARA

MDI sunspot

catalog

(

F.Watson, NSO)

:SOHO MDI continuum imagesResolution: 2”/pixelIndividual

sunspots (not tracked)Two versions built separately: Whole spot (penumbral area)

Separate umbral areas

21/11/2014ESWW11 – Nov. 201416Slide17

Main Sources of mismatch

DPD spot classification:“Too” detailed: sunspot classes without equivalent in other catalogs

:

P

enumbrae without umbrae

S

mall

umbral

kernels inside common penumbrae

Dropped in sunspot area comparisons

Time difference between daily DPD and STARA observations:

STARA

version 1: mean

t=10 h

Image closest to daily magnetogram

Poor match for small spots due to spot evolution over 10 hours.STARA version 2:mean ∆t=

2-3 hWe use only version 2

21/11/2014ESWW11 – Nov. 2014

17

-20 -10 0 10 20

t DPD-STARA (hours)NNSlide18

Sunspot group matching: movie

ESWW11 – Nov. 201418

21/11/2014Slide19

Matching in distance and size

21/11/2014ESWW11 – Nov. 201419

All

UP > 10msh

UP> 100

msh

UP> 500

msh

Sunspot position: very accurate match

Mean difference:

0.35°

max. ~5° (due to splitting of large complex spots)

Sunspot

areas

(

umbra+penumbra

): good match

No bias: mean ratio = 1

RMS dispersion increases for small sunspot areas:

10msh<A<100msh: σ= 20%Main causes of

larger differences in small spot areas:DPD-STARA time difference: small spots evolve fasterMDI lower spatial resolution (2 “): pixel quantizationSlide20

Catalog matching: conclusions

Total number of individual spots: 57500Matching in DPD & STARA: 93 %Non-matching: 7 % (mainly small short-lived spots)Sunspot areas: the accuracy of DPD sunspot areas is the best available among existing catalogs

The comparison with STARA confirms the accuracy of areas

for A >

30msh

For A <

30msh, only DPD: results still rest on the intrinsic stability of the DPD catalog construction

Sunspot counts: no systematic variation over

time

found in the DPD

catalog

(

T. Baranyi, private

communication)The in/exclusion of DPD-specific classes does not influence the time variations found in the small-spot population.

21/11/2014ESWW11 – Nov. 2014

20Slide21

Variations of Other sunspot properties

21/11/2014ESWW11 – Nov. 2014

21Slide22

Decline

of core magnetic fieldsAverage core magnetic field in umbra (FeI line: 1565 nm,

Kitt

Peak)

21/11/2014

22

Solar cycle modulation

(

Nagovitsyn

et al., 2012)

NB: only the strongest field each day.

ESWW11 – Nov. 2014

Linear

decline

-

40

G/

year

(Penn & Livingston 2011, 2013)

Most

recent

data (2014): BABO (

Penn & Livingston)

, MDI/HMI

(F. Watson)

Decline

has

stopped

in cycle 24, but no

solar cycle modulationSlide23

Growth/decay rates of active regions

Study of group growth and decline (Javaraiah 2011):Data: Greenwich photographic catalog, USAF/SOON catalog

In

cycle 23:

Lower growth rate

Decay rate increasing

Scarcity

of groups with A < 37 msh (Javaraiah 2013)

Coherent with sunspot deficit

Weaker growth rates similar to moderate cycles 12 to14

21/11/2014

ESWW11 – Nov. 2014

23

Growth

Decay

Javaraiah

2011Slide24

Implications: a shallow dynamo?

Solar-cycle modulation of high-

frequency

p-modes

(

Basu

et al. 2013)

: BISON dataTop layers

(r

>

0.997

r

ʘ

): deviate after

1998Deeper layer: deviation during entire cycle 23

Thinning of the subsurface magnetic field

layer (< 20000 km)

21/11/2014ESWW11 – Nov. 2014

Basu et al. 2013

24

Dynamo

models

:

Are

there

two

dynamo components,

deep

and

shallow ? Does the near-surface shear layer play an independant

role?Babcock-Leighton

near-surface flux diffusion mechanism (Muñoz-Jaramillo

et al. 2010, 2011)Role of a near-surface shear layer (A. Brandenburg 2005, Brnadenburg et al., 2013)Near-surface magnetic flux aggregation mechanism (K. Schatten 2009, Rempel, et al 2009)Slide25

Implications for the TSI – SSI reconstructions

Vanishing small spots = irradiance excess ?Less sunspots (B < 1500 G spot formation threshold)Lower sunspot blocking (visible + IR)Additional contribution to

plage

and network

Excess in near-UV

,

microwaves (and

solar wind ?)Possible cause of the divergence between sunspot indices and solar proxies

21/11/2014

ESWW11 – Nov. 2014

25

Can this

“reversal”

process reduce

the effective irradiance decrease expected at low solar activity?

(Grand Minima?)

Base level in solar flux close to the last SC23-24 minimum

(

Schrijver

et al. 2011)

Proxies cannot be based on a simple linear extrapolation of recent high solar cycles (scale-dependant, lifetimes)Slide26

Conclusions

Multiple evidence of a global change in small-scale sunspot magnetic fieldsStill unclear if the current change is:A steady evolution towards a new activity regimeA larger deviation in a global solar cycle modulationLong-

term

variations of the

number

of spots per group

Results supported by

In-depth validation DPD sunspot catalog versus the MDI/STARA

catalog

Recalibrated SN and GN series

Limited

rise

of

average

solar

activity since the Maunder minimumConcept of a Grand Maximum in the 20

th century is questioned

Release of new the SN and

GN series by mid-201521/11/2014

ESWW11 – Nov. 201426Slide27

More information available at …

21/11/2014ESWW11 – Nov. 2014

27

http://sidc.be/silso

http://

ssnworkshop.wikia.com/wiki/Home

http://haso.unex.es/

Sunspot

Number

Workshops

Historical

Archive of

Sunspot

Observations

WDC –

SILSO

Sunspot

Index

and

Long-term Solar ObservationsSlide28

21/11/2014

ESWW11 – Nov. 201428Slide29

Long-term integration

: a moderate Modern Maximum ?Time-integrated responses to the solar

input:

Cosmogenic

isotopes:

deposition

processes

(ice, sediments)

Earth

climate

: thermal

inertia

of

oceansGaussian running mean over 22

years (2 solar cycles):21/11/2014

ESWW11 – Nov. 201429

Original series

Ratio Max cycles 3-19 = 1.27

Ratio 22-yr envelope = 1.30

Corrected series

Ratio Max cycles 3-19 = 1.08

Ratio 22-yr envelope = 1.17

The

clustering

of high

solar

cycles

reduces

the time-

integrated

effects

of the corrections by 50%Slide30

Sunspot areas versus F10.7

Same F10.7 excess versus SOON sunspot areas in the late part of cycle 23 (Hathaway 2010, 2013)

21/11/2014

ESWW11 – Nov. 2014

30

F10.7 vs SSN

F10.7 vs

sunspot

areaSlide31

Cycle 23 small

-spot deficit

De

Toma

et al., 2013

Contradictory results from

de

Toma

et al. (2013)

:

Based on San Fernando Obs. Images

Small spots: no decline

Large spots: decrease in cycle 23

but

Spatial resolution

of

the CFDT1 instrument is

too low for analysis of the smallest spots (>5”/pixel).Smallest spots <30

msh are not properly detected.21/11/2014

ESWW11 – Nov. 201431Slide32

DPD: an example

A very detailed dataset

NOAA 7815

Common penumbra

Master Spot corresponding to this common penumbra

Penumbra with no umbra (U=0)

Not very contrasted

21/11/2014

ESWW11 – Nov. 2014

32Slide33

Area differences

The main difference between MDI images and DPD images is due to the lower resolution of MDI

images

Area

difference of two circles with radius r and

r+dr

is

dA

/A

2dr/r

Bias appears when A is close or below the pixels size.

Gyori

et al., 2004

(

STARA- DPD

)/DPD

50000

points

(SOHO-DPD)/DPD 100 points

Confirmed by this study:

much

larger statistics (50000 spots instead of < 100

)Slide34

Sunspot number versus other solar indices and fluxes

Very high correlation with photospheric parameters (R2 >0.95): RG, RA

,

R

Boulder

, Area,

Mx

(Bachmann et al. 2004, Rybansky et al. 2005, Wilson and Hathaway 2006, Tapping et al. 2007,

Bertello

et al. 2010,

Hempelmann

and Weber 2012)

Measure of the global emergence rate of (

toroidal

) magnetic flux (Petrovay 2010,

Stenflo 2012)Chromospheric and mixed indices (TSI

, CaII-K, MgII):Good but lower correlations:Non-linear relationTime lags (magn

. flux dispersion)Different physics !21/11/2014

ESWW11 – Nov. 201434

Mean

mag. flux

Sunspot Nb.Stenflo, 2012Solanki

&

Fligge

1999Slide35

Sunspot number versus other solar indices and fluxes

Blind Source Separation applied solar radio and UV indices:Method: Bayesian positive source separation (Moussaoui et al. 2006)21/11/2014

ESWW11 – Nov. 2014

35

3 clusters of indices, each dominated by one of 3 sources :

Photosphere (SN, GN)

Chromospheric

(DSA,

MgII

, Ly

α

, radio

λ

> 10cm)

Coronal (radio

λ

< 10cm)

T.

Dudok

de Wit, SSN2 Workshop, 2012

Corona

Chromosphere

Chromosphere

Photosphere

Network,

plages

Radio

gyroresonance

Active regionsSlide36

Cycle 24 in the long-

term SN perspectiveCycle 24 is among the late cycles

Tie-point (

R

i

=13) at the end of preceding cycle

2 main cycle “families”:

Steep – strong

(max > 130)

Slow –

weak

(max < 80)

Best

fit

with

cycles 12, 14, 15, 16 Tie-point (Ri=40) in the rising phase of the cyclesReturn to an average activity regime

like in the late 19th and early 20th century

21/11/2014ESWW11 – Nov. 2014

36Slide37

Cycle

24 best matches:Cycle 14 [1902-1913]: Rmax = 64.2

Cycle 15 [1913-1923]:

R

max

= 105.4

!

3 features of moderate cycles:Plateau (duration up to 3 years)Multiple sharp peaks

Late maximum

(~highest random peak)

Cycle decline by mid-2015

Next minimum in 2019-2020

21/11/2014

ESWW11 – Nov. 2014

Cycle 15

37

Cycle 14

Cycle 24 in the long-

term

SN perspective