/
1  &#x/MCI;
 0 ;&#x/MCI;
 0 ;An error has been found effecting t 1  &#x/MCI;
 0 ;&#x/MCI;
 0 ;An error has been found effecting t

1 &#x/MCI; 0 ;&#x/MCI; 0 ;An error has been found effecting t - PDF document

tatyana-admore
tatyana-admore . @tatyana-admore
Follow
399 views
Uploaded On 2015-11-25

1 &#x/MCI; 0 ;&#x/MCI; 0 ;An error has been found effecting t - PPT Presentation

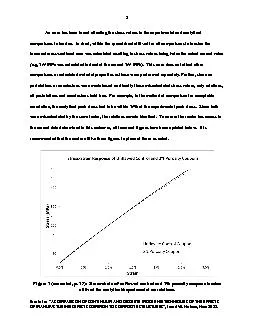
Errata for 147A COMPARISON OF CONTINUUM AND DISCRETE MODELING TECHNIQUES OF THE EFFECTS OF MANUFACTURING DEFECTS COMMON TO COMPOSITE STRUCTURES148 Jared W Nelson Nov2012 2 xMCIxD ID: 205204

Errata for “A COMPARISON

Share:

Link:

Embed:

Download Presentation from below link

Download Pdf The PPT/PDF document "1 &#x/MCI; 0 ;&#x/MCI; 0 ;An er..." is the property of its rightful owner. Permission is granted to download and print the materials on this web site for personal, non-commercial use only, and to display it on your personal computer provided you do not modify the materials and that you retain all copyright notices contained in the materials. By downloading content from our website, you accept the terms of this agreement.


Presentation Transcript

��1 &#x/MCI; 0 ;&#x/MCI; 0 ;An error has been found effecting the stress values in the experimental and analytical comparisons in tension. In short, within the spreadsheet utilized for all comparisons in tension the incorrect crosssectional area was calculated resulting in stress values being twice the actual correct value (e.g. 200 MPa was calculated instead of the correct 100 MPa). This error does not affect other comparisons or calculated material properties as those were performed separately. Further, since no postulations or conclusions were made based on directly these miscalculated stress values, only relations, all postulations and conclusions hold true. For example, in the method of comparison for acceptable correlation, the analytical peak stress had to be within 10% of the experimental peak stress. Since both were miscalculated by the same factor, the relations remain identical. To ensure the reader has access to the correct data determined in this endeavor, all incorrect figures have been updated below.It is recommended that the reader utilize these figures in place of those as noted. Figure (corrected: Stressstrain of unflawed control and 2% porosity coupons tension utilized for analytical/experimental correlations. ��Errata for “A COMPARISON OF CONTINUUM AND DISCRETE MODELING TECHNIQUES OF THE EFFECTS OF MANUFACTURING DEFECTS COMMON TO COMPOSITE STRUCTURES”, Jared W. Nelson, Nov2012. ��2 &#x/MCI; 0 ;&#x/MCI; 0 ; &#x/MCI; 1 ;&#x/MCI; 1 ;Figure (corrected: Stressstrain of IP Wave 1 in tension and compression utilized for baseline model correlations with associated experimental variability.Figure (corrected: Stressstrain of OP Wave 4A in tension utilized for initial OP wave model correlations. ��Errata for “A COMPARISON OF CONTINUUM AND DISCRETE MODELING TECHNIQUES OF THE EFFECTS OF MANUFACTURING DEFECTS COMMON TO COMPOSITE STRUCTURES”, Jared W. Nelson, Nov2012. ��3 &#x/MCI; 0 ;&#x/MCI; 0 ; &#x/MCI; 1 ;&#x/MCI; 1 ;Figure (corrected, p. 115: Comparison of [(0)] laminate BMT Control and linear elastic model in tension results indicating good correlation. Figure (corrected, p. 131: Comparison of 2% Porosity BMT and linear elastic with Hashin failure criteria model in tension results indicating good correlation. ��Errata for “A COMPARISON OF CONTINUUM AND DISCRETE MODELING TECHNIQUES OF THE EFFECTS OF MANUFACTURING DEFECTS COMMON TO COMPOSITE STRUCTURES”, Jared W. Nelson, Nov2012. ��4 &#x/MCI; 0 ;&#x/MCI; 0 ; &#x/MCI; 1 ;&#x/MCI; 1 ;Figure (corrected, p. 135: Stressstrain comparison of IP wave BMT and linear elastic with Hashin failure criteria model in tension results indicating good correlation.Figure (corrected, p. 137: Stressstrain comparison of IP wave BMT and linear elastic with Hashin failure criteria model in tension results indicating good correlation. ��Errata for “A COMPARISON OF CONTINUUM AND DISCRETE MODELING TECHNIQUES OF THE EFFECTS OF MANUFACTURING DEFECTS COMMON TO COMPOSITE STRUCTURES”, Jared W. Nelson, Nov2012. ��5 &#x/MCI; 0 ;&#x/MCI; 0 ; &#x/MCI; 1 ;&#x/MCI; 1 ;Figure (corrected, p. 147: Stressstrain comparison of OP wave BMT and linear elastic with Hashin failure criteria model in tension results indicating good overall correlation.Figure (corrected, p. 149: Stressstrain comparison of 16° and 48° IP waves cases in tension results indicating reasonable overall correlation and prediction. ��Errata for “A COMPARISON OF CONTINUUM AND DISCRETE MODELING TECHNIQUES OF THE EFFECTS OF MANUFACTURING DEFECTS COMMON TO COMPOSITE STRUCTURES”, Jared W. Nelson, Nov2012. ��6 &#x/MCI; 0 ;&#x/MCI; 0 ; &#x/MCI; 1 ;&#x/MCI; 1 ;Figure (corrected, p. 153: Stressstrain comparison of fiberglass composite from BMT and model with Hashin failure criteria with predicted carbon response for IP wave with same Hashin model.Figure (corrected, p. 173: Stressstrain comparison of IP wave BMT and initial linear elastic with userdefined failure criteria model in tension. ��Errata for “A COMPARISON OF CONTINUUM AND DISCRETE MODELING TECHNIQUES OF THE EFFECTS OF MANUFACTURING DEFECTS COMMON TO COMPOSITE STRUCTURES”, Jared W. Nelson, Nov2012. ��7 &#x/MCI; 0 ;&#x/MCI; 0 ; &#x/MCI; 1 ;&#x/MCI; 1 ;Figure (corrected, p. 175: Reprint of stressstrain curve from Figure with addition of tuned linear elastic with userdefined failure criteria model in tension. Figure (corrected, p. 195Stressstrain comparison of IP wave BMT and initial nonlinear shear UMAT model in tension. ��Errata for “A COMPARISON OF CONTINUUM AND DISCRETE MODELING TECHNIQUES OF THE EFFECTS OF MANUFACTURING DEFECTS COMMON TO COMPOSITE STRUCTURES”, Jared W. Nelson, Nov2012. ��8 &#x/MCI; 0 ;&#x/MCI; 0 ; &#x/MCI; 1 ;&#x/MCI; 1 ;Figure (corrected, p. 196Reprint of stressstrain curve from Figure with addition of an unacceptably tuned nonlinear shear UMAT model in tension.Figure (corrected, p. 214: Stressstrain comparison of IP wave BMT and cohesive element DDM in tension. ��Errata for “A COMPARISON OF CONTINUUM AND DISCRETE MODELING TECHNIQUES OF THE EFFECTS OF MANUFACTURING DEFECTS COMMON TO COMPOSITE STRUCTURES”, Jared W. Nelson, Nov2012. ��9 &#x/MCI; 0 ;&#x/MCI; 0 ; &#x/MCI; 1 ;&#x/MCI; 1 ;Figure (corrected, p. 237: Stressstrain comparison of IP wave BMT and combined model in tension.Figure (corrected, p. 246: Stressstrain comparison of OP wave BMT andcombined model in tension. ��Errata for “A COMPARISON OF CONTINUUM AND DISCRETE MODELING TECHNIQUES OF THE EFFECTS OF MANUFACTURING DEFECTS COMMON TO COMPOSITE STRUCTURES”, Jared W. Nelson, Nov2012. ��10 &#x/MCI; 0 ;&#x/MCI; 0 ; &#x/MCI; 1 ;&#x/MCI; 1 ;Figure (corrected, p. 249: Stressstrain response of combined model in compression shown with OP wave BMT and combined model in tension for comparison.Figure (corrected, p. 251: Stressstrain comparison of 16° and 48° IP wave cases in tension with results indicating reasonable overall correlation and prediction. ��Errata for “A COMPARISON OF CONTINUUM AND DISCRETE MODELING TECHNIQUES OF THE EFFECTS OF MANUFACTURING DEFECTS COMMON TO COMPOSITE STRUCTURES”, Jared W. Nelson, Nov2012. ��11 &#x/MCI; 0 ;&#x/MCI; 0 ; &#x/MCI; 1 ;&#x/MCI; 1 ;Figure (corrected, p. 256: Stressstrain comparison of fiberglass composite from BMT and combined model with predicted carbon response for IP wave with same combined model.Figure (corrected, p. 262: Stressstrain correlations of common IP Wave for each model technique compared to BMT results. ��Errata for “A COMPARISON OF CONTINUUM AND DISCRETE MODELING TECHNIQUES OF THE EFFECTS OF MANUFACTURING DEFECTS COMMON TO COMPOSITE STRUCTURES”, Jared W. Nelson, Nov2012. ��12 &#x/MCI; 0 ;&#x/MCI; 0 ; &#x/MCI; 1 ;&#x/MCI; 1 ;Figure (corrected, p. 269: Stressstrain correlations of common IP Wave for Hashin FC and Combined techniques compared to BMT results. ��Errata for “A COMPARISON OF CONTINUUM AND DISCRETE MODELING TECHNIQUES OF THE EFFECTS OF MANUFACTURING DEFECTS COMMON TO COMPOSITE STRUCTURES”, Jared W. Nelson, Nov2012.