/
Example 7.1.1: Randomization Example 7.1.1: Randomization

Example 7.1.1: Randomization - PowerPoint Presentation

tatyana-admore
tatyana-admore . @tatyana-admore
Follow
421 views
Uploaded On 2016-09-16

Example 7.1.1: Randomization - PPT Presentation

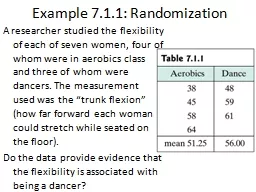
A researcher studied the flexibility of each of seven women four of whom were in aerobics class and three of whom were dancers The measurement used was the trunk flexion how far forward each woman could stretch while seated on the floor ID: 466852

cont test statistic toluene test cont toluene statistic pain study directional lengths brain region hypothesis shown data tibia distribution level state drug

Share:

Link:

Embed:

Download Presentation from below link

Download Presentation The PPT/PDF document "Example 7.1.1: Randomization" is the property of its rightful owner. Permission is granted to download and print the materials on this web site for personal, non-commercial use only, and to display it on your personal computer provided you do not modify the materials and that you retain all copyright notices contained in the materials. By downloading content from our website, you accept the terms of this agreement.


Presentation Transcript

Slide1

Example 7.1.1: Randomization

A researcher studied the flexibility of each of seven women, four of whom were in aerobics class and three of whom were dancers. The measurement used was the “trunk flexion” (how far forward each woman could stretch while seated on the floor). Do the data provide evidence that the flexibility is associated with being a dancer?Slide2

Example 7.1.2Slide3

Example 7.1.2 (cont)Slide4

Hypothesis testing: Questions

Categorical (Chapter 9) Is the success probability = ½? Is the success probability = p?Normal Distribution

Is the population mean = 50?

Is the population mean =

0

Normal Distribution: 2 populations

Do the two populations have the same mean?

Is the difference of the two population means = d?Slide5

Procedure (1/4)

State the scientific question to be answered. Use complete sentences, no symbols (optional on Homework)

Define the parameters of interest. (e.g.,

m

1

, m

2

and what each refers to.

)

State the H

0

and H

A

hypothesis mathematically (in terms of parameters)

H

0

: usually ‘=‘, H

A

: usually ‘<‘, ‘>’, ‘

’

State the significance level

a.

If not stated explicitly,

a

= 0.05Slide6

Procedure (2/4)

5. Calculate the test statistic from the data. test statistic: t, F, WMW also include all additional parameters necessary, like

df

6. Calculate the rejection region by finding the critical value using the distribution the test statistic follows under H

0

. If required calculate the P-value.

This (with

)

defines the rejection regionSlide7

Procedure (3/4)

7. Compare the test statistic to the rejection region or compare the P-value to a. Is the test statistics ≤ or ≥ the critical value?

Is the P-value ≤

8. Make a decision about the null hypothesis:

If the test statistic is in the rejection region, or the p-value is smaller than

a

, state “reject the null hypothesis”

If not, state “do not reject the null hypothesis”

Never use the word ‘accept’.Slide8

Procedure (4/4)

9. Form a scientific conclusion based on that decision.If 8a) then start with “This study provides evidence…”If 8b) then start with “This study does not provide evidence…”Followed by “[(P = x)] at the ___ significance level that “ followed by the verbal statement of the

alternative

hypothesis.

use complete sentences with no symbols (except possibly P) – Don’t be creative!Slide9

Example 7.2.1: Toluene and the Brain

In an investigation of the mechanism of the toxic effects of toluene in the brain, the concentration of brain NE (norepinephrine) in a toluene-laden atmosphere on the medulla region of rats’ brains, the observed mean NE in the toluene group (mean y

1

= 540.8

ng

/g) was substantially higher than the mean in the control group(mean y

2

= 444.2

ng

/g).

Is this a real biological effect?

What are the null and alternative hypothesis?Slide10

Example 7.2.1 (cont)Slide11

Example: Hypotheses

Seedlings were germinated under two different lighting conditions. Their lengths (in cm) were measured after a specified time period. The data are as follows:

What are H

0

and H

a

?

Dark

Light

n

22

21

1.76

2.46

SE

0.125

0.175Slide12

Example 7.2.2: Toluene and the Brain

In an investigation of the mechanism of the toxic effects of toluene in the brain, the concentration of brain NE (norepinephrine) in a toluene-laden atmosphere on the medulla region of rats’ brains, the observed mean NE in the toluene group (mean y

1

= 540.8

ng

/g) was substantially higher than the mean in the control group(mean y

2

= 444.2

ng

/g).

Is this a real biologically effect?

What is the test statistic?Slide13

Example: Test Statistic

Seedlings were germinated under two different lighting conditions. Their lengths (in cm) were measured after a specified time period. The data are as follows:

What are H

0

and H

a

?

What is the test statistic?

Dark

Light

n

22

21

1.76

2.46

SE

0.125

0.175Slide14

t

s locationSlide15

P-valueSlide16

Interpretation of P-valueSlide17

Example: two sample, non directional

In a study of the periodical cicada (Magicicada septendecim), researchers measured the hind tibia lengths of the shed skins of 100 individuals. Results for males and females are shown below. Assuming that hind tibia lengths follow a normal distribution, compare the mean hind tibia lengths for male and female cicadas using an appropriate hypothesis test.

Tibia

Length

(m

m

)

Males

Females

n

54

48

78.42

80.44

SD

2.87

3.52Slide18

Example: two sample, non directional (cont)

If reject H0:Answer: This study provides evidence (P = 0.0024) at the 0.05 significance level that male and female cicadas have different mean tibia lengths.

If fail to reject H

0

:

Answer: This study does not provide evidence (P = 0.24) at the 0.05 significance level that male and female cicadas have different mean tibia lengths.Slide19

P-value vs. 

aSlide20

One-Tailed t testSlide21

One-tailed P-test (cont)Slide22

Example: two sample, directional

A pain-killing drug was tested for efficacy in 50 women who were experiencing uterine cramping pain following childbirth. 25 of the women were randomly allocated to receive the drug and the remaining 25 received a placebo. Capsules of the drug or placebo were given before breakfast and again at noon. A pain relieve score, based on hourly questioning through the day, was computed for each woman. The possible pain relief scores ranged from 0 (no relief) to 56 (complete relief for 8 hours). Summary results are shown in the table on the next slide. Assuming that the pain relief scores approximately follow a normal distribution, test for efficacy of the drug at reducing uterine cramping pain.Slide23

Example: two sample, directional

Pain Relief

Score

Placebo

Drug

n

25

25

31.96

25.32

SD

12.05

13.75Slide24

Example: two sample, directional

This study does not provide evidence (P > 0.5) at the 0.05 significance level that the drug is more effective than the placebo at reducing uterine cramping painSlide25

Example 7.6.1: large n

Lactate dehydrogenase (LD) is an enzyme that may show elevated activity following damage to the heart muscle or other tissues. A large study of serum LD levels in healthy young people yielded the results shown below.Slide26

Example 7.6.2: small n

Imagine that we are studying the body weight of men and women, and obtain the realistic (fictitious) data shown below.Slide27

Example 7.6.1: (cont)

Lactate dehydrogenase (LD) is an enzyme that may show elevated activity following damage to the heart muscle or other tissues. A large study of serum LD levels in healthy young people yielded the results shown below.Slide28

Example 7.6.1: (cont)Slide29

Example 7.6.2: (cont)

Imagine that we are studying the body weight of men and women, and obtain the realistic (fictitious) data shown below.Slide30

Example 7.6.2: (cont)Slide31

Magnitude of Effect SizeSlide32

Table 5: Number of Observations

for Independent-Samples t TestSlide33

Summary of t Test MechanicsSlide34

Table 6: Critical Values of U

s

Note: U

s

in

bold

P-values (non-directional) in

italics

Directional P-values: divide number by 2Slide35

Example: WMW

The sage cricket, Cyphooderris stepitans, mates unusually. During mating the female eats the male’s fleshy hind wings; the wounds are not fatal. The females prefer males that have not already been wounded. The scientific question is: ”Are females more likely to mate if they are hungry?”Slide36

Example: WMW (cont)Slide37

Example: WMW (cont)

2

0

2

2

2

2

4

2

2

4

5

5

5

5

5

5

7

10

0

0

0

0

2

0

0

2

2

3

9

9

10

10

10

11

11

11