/
Iowa Farm Costs and Returns File C FM  Revised October  Ag Decision Maker The data for Iowa Farm Costs and Returns File C FM  Revised October  Ag Decision Maker The data for

Iowa Farm Costs and Returns File C FM Revised October Ag Decision Maker The data for - PDF document

tatyana-admore
tatyana-admore . @tatyana-admore
Follow
616 views
Uploaded On 2014-12-03

Iowa Farm Costs and Returns File C FM Revised October Ag Decision Maker The data for - PPT Presentation

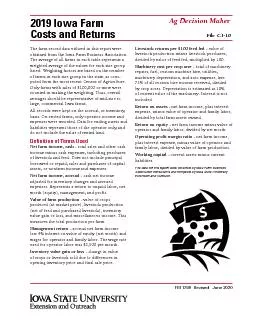
The farm record data utilized in this report were obtained from the Iowa Farm Business Association annual summary The average of all farms in each table represents a weighted average of the values for each size group listed Weight ing factors are ba ID: 20369

The farm record data

Share:

Link:

Embed:

Download Presentation from below link

Download Pdf The PPT/PDF document "Iowa Farm Costs and Returns File C FM R..." is the property of its rightful owner. Permission is granted to download and print the materials on this web site for personal, non-commercial use only, and to display it on your personal computer provided you do not modify the materials and that you retain all copyright notices contained in the materials. By downloading content from our website, you accept the terms of this agreement.


Presentation Transcript

Ag Decision Maker 2019 Iowa Farm Costs and Returns FM 1789 Revised June 2020 The farm record data utilized in this report were obtained from the Iowa Farm Business Association. The average of all farms in each table represents a weighted average of the values for each size group listed. Weighting factors are based on the number of farms in each size group in the state, as com - puted from the most recent Census of Agriculture. Only farms with sales of $100,000 or more were counted in making the weighting. Thus, overall averages should be representative of mid-size to large, commercial Iowa farms. All records were kept on the accrual, or inventory, basis. On rented farms, only operator income and expenses were recorded. Data for ending assets and liabilities represent those of the operator only, and do not include the value of rented land. Definition of Terms Used Net farm income, cash - total sales and other cash income minus cash expenses, including purchases of livestock and feed. Does not include principal borrowed or repaid, sales and purchases of capital assets, or nonfarm income and expenses. Net farm income, accrual - cash net income adjusted for inventory changes and accrued expenses. Represents a return to unpaid labor, net worth (equity), management, and profit. Value of farm production - value of crops produced (at market price), livestock production (net of feed and purchased livestock), inventory value gain or loss, and miscellaneous income. This measures the total production per farm. Management return - accrual net farm income less 4% interest on value of equity (net worth) and wages for operator and family labor. The wage rate used for operator labor was $2,500 per month. Inventory value gain or loss - change in value of crops or livestock sold due to differences in opening inventory price and final sale price. Livestock returns per $100 feed fed - value of livestock production minus livestock purchases, divided by value of feed fed, multiplied by 100. Machinery cost per crop acre - total of machinery repairs, fuel, custom machine hire, utilities, machinery depreciation, and auto expense, less 75% of all custom hire income received, divided by crop acres. Depreciation is estimated at 10% of current value of the machinery. Interest is not included. Return on assets - net farm income, plus interest expense, minus value of operator and family labor, divided by total farm assets owned. Return on equity - net farm income minus value of operator and family labor, divided by net worth. Operating profit margin ratio - net farm income, plus interest expense, minus value of operator and family labor, divided by value of farm production. Working capital - current assets minus current liabilities. The data for this report were collected by Iowa Farm Business Association consultants and compiled by Iowa State University Extension and Outreach. File C1-10 Page 2 Iowa Farm Costs and Returns 2015-2019 The following summary is intended to provide a general picture of costs and returns to well-managed, full-time Iowa farms. The values presented are averages; however, results vary widely from one farm to the next. The average number of crop acres per farm increased by 6 acres to 674 acres in 2019, the second lowest mark since 2013. The average value of total farm assets and farm net worth increased, respectively, by $148,234 (+6%) and $79,138 (+5%). The average accrual net farm income increased by $19,114 to $77,946 in 2019, its highest level since 2014. Livestock returns per $100 feed fed declined by 2% to $158 in 2019. The average sale price for corn increased by 8% to $3.68 and the average corn yield declined by 1% to 199 bushels per acre. The average debt-to-asset ratio increased by 1% to 0.25 in 2019, its highest level since 2008. The average current asset-to-debt ratio, a relative measure of liquidity, decreased to 2.69 in 2019, its lowest level since 2001 (when it was 2.46). Table 1. Comparison by Years 2019 2018 2017 1/ 2016 2015 2/ Financial Returns Net farm income, accrual $77,946 $58,832 $55,266 $45,597 $27,927 Return to management -31,252 -45,358 -53,925 -63,620 -85,187 Net farm income, cash 85,097 86,480 55,029 92,500 94,990 Resources Used Acres in crops 674 668 689 694 707 Labor months 21 19 20 19 18 Livestock, feed, supplies $600,110 $583,011 $611,903 $586,669 $635,031 Machinery and equipment 472,898 461,390 499,514 500,782 517,123 Land and improvements 1,470,496 1,350,870 1,431,324 1,347,510 1,380,356 Total farm assets $2,543,504 $2,395,270 $2,542,741 $2,434,961 $2,532,510 Farm net worth $1,791,128 $1,711,990 $1,833,866 $1,807,856 $1,918,009 Value of Farm Production Livestock income less feed, purchases for resale $64,130 $34,904 $75,306 $25,395 $18,671 Crop production 427,857 430,542 434,481 455,336 431,461 Miscellaneous 127,320 110,925 87,556 97,375 118,214 Crop inventory gain or loss 15,247 -4,432 -2,122 -118 5,295 Value of farm production $634,555 $571,939 $595,220 $577,989 $573,641 Cash Expenses Operating $301,941 $273,441 $284,059 $283,007 $285,204 Fixed 254,668 239,665 255,895 249,384 260,510 Efficiency Corn yield (bushels per acre) 199 201 214 209 200 Average sale price for corn, per bushel $3.68 $3.40 $3.28 $3.43 $3.71 Crop value per acre $606 $617 $604 $635 $588 Machinery cost per crop acre $145 $137 $136 $131 $133 Livestock returns per $100 feed fed $158 $161 $179 $117 $133 Gross revenue per person $416,983 $418,186 $421,783 $420,420 $452,035 Gross revenue per $1 expense $1.13 $1.12 $1.08 $1.12 $1.09 Gross revenue per $1 assets $0.28 $0.27 $0.27 $0.27 $0.27 Return on assets (ROA) 2.7% 2.2% 1.5% 1.7% 1.1% Return on equity (ROE) 2.1% 1.4% 0.8% 1.0% 0.2% Financial Debt-to-asset ratio 0.25 0.24 0.24 0.22 0.21 Current asset-to-debt ratio 2.69 3.14 2.77 3.30 3.32 Farm net worth per acre farmed $2,961 $2,870 $2,918 $2,872 $2,897 1/ Revised with weights from the 2017 Census of Agriculture. 2/ Revised with additional farm data. Page 3 Assets and Liabilities A breakdown of farm assets and liabilities by value of gross sales per farm is shown in Table 2. Total assets, total liabilities, and the total debt-to-asset ratio increased with farm size, indicating that larger farms utilized relatively more credit and were more leveraged than smaller farms. Total liabilities in 2019 were higher than in 2018 across all groups. However, the increase in total assets more than offset the increase in liabilities resulting in higher farm net worth for all groups but the third group ($400,000-$799,999 in gross sales). Relative measures of liquidity suggest that smaller farms were better positioned to cover short-term liabilities than larger farms. However, while the smallest farms and the third group of farms experienced 11% and 12% losses in working capital from 2018, the second group ($200,000-$399,999 in gross sales) and the largest farms saw their working capital increase by 15% and 5%, respectively. Average working capital increased by 1% to $326,022 in 2019, marking the first increase since 2012. Table 2. Assets and Liabilities by Size of Farm, End of Year Values Total Value of Gross Sales Average $100,000 to $199,999 $200,000 to $399,999 $400,000 to $799,999 $800,000 and above Farm Assets Feeding livestock $118,842 $6,005 $11,037 $23,023 $390,332 Crop inventory 350,840 104,762 226,360 333,368 669,921 Cash 54,680 10,098 38,925 84,741 76,821 Supplies, prepaid expenses, other 1/ 75,748 21,662 61,480 78,910 127,360 Total short-term assets $600,110 $142,527 $337,802 $520,042 $1,264,433 Breeding livestock $31,417 $8,946 $9,010 $14,180 $84,744 Machinery, equipment 418,929 124,138 205,628 410,977 850,310 Other intermediate assets 2/ 22,552 7,749 3,746 72,825 7,237 Total intermediate assets 472,898 $140,833 $218,385 $497,982 $942,290 Land and improvements $1,470,496 $692,446 $1,154,380 $1,404,056 $2,416,126 Total assets $2,543,504 $975,805 $1,710,566 $2,422,080 $4,622,850 Farm Liabilities Operating notes, accounts payable $267,788 $42,849 $111,157 $175,648 $666,951 Intermediate and long-term due 6,000 838 1,861 9,566 10,672 Other short term debt 3/ 300 0 169 136 797 Total short-term debt $274,088 $43,687 $113,186 $185,351 $678,420 Intermediate-term debt $290,547 $48,769 $80,411 $259,320 $699,311 Long-term debt $187,741 $49,207 $131,849 $179,288 $352,769 Total liabilities $752,376 $141,663 $325,446 $623,959 $1,730,500 Farm Net Worth $1,791,128 $834,143 $1,385,120 $1,798,121 $2,892,350 Net worth change from last year $79,138 $25,371 $103,764 -$52,277 $212,298 Working capital $326,022 $98,840 $224,615 $334,691 $586,013 Current asset-to-debt ratio 2.69 3.26 2.98 2.81 1.86 Working capital per $1 of gross revenue $0.52 $0.59 $0.68 $0.56 $0.27 Total debt-to-asset ratio 0.25 0.15 0.19 0.26 0.37 Total crop acres farmed 674 224 412 691 1,246 Months of labor used 21 10 12 15 42 Farm net worth per acre farmed $2,961 $3,721 $3,364 $2,603 $2,322 1/ Purchased feed, accounts receivable, hedging accounts, sealed grain, investment in growing crops, short term loans. 2/ Capital leases, investment in cooperatives. 3/ Labor related liabilities, accrued interest, taxes payable, and other current liabilities. Page 4 Income and Expenses A summary of operating and fixed expenses by value of gross sales per farm is shown in Table 3. Crop expenses include seed, fertilizer, pesticides and other expenses related to crop production. The average farm generated a net farm cash flow of $86,335 for replacement of capital assets, expansion, savings, living expenses and income taxes. Such amount was 19% or $20,600 lower than in the previous year, driven mainly by a marked reduction in net borrowing (-$19,200) and to a lesser extent by a reduction in cash net farm income (-$1,400). Other Cash Income, which includes government payments from the Market Facilitation Program, surpassed soybean sales among the largest farms ($290,096 vs. $231,638). Table 3. Summary of Cash Income and Expenses by Size of Farm Average Total Value of Gross Sales $100,000 to $199,999 $200,000 to $399,999 $400,000 to $799,999 $800,000 and above Income Livestock sales $298,878 $5,065 $9,414 $37,115 $1,024,858 Corn sales 239,589 71,998 143,956 269,475 430,352 Soybean sales 128,086 35,302 88,192 132,987 231,638 Other crop sales 15,543 5,518 8,813 13,586 31,205 Other cash income 133,644 29,694 61,497 122,623 290,096 Total cash income $815,740 $147,577 $311,873 $575,785 $2,008,149 Expenses Machinery and equipment repairs $28,336 $7,955 $14,687 $26,894 $57,908 Fuel and oil 20,377 5,378 9,311 15,387 46,566 Machine hire 16,491 5,031 7,226 13,585 36,465 Auto and truck expense 5,878 2,586 4,241 5,488 10,257 Utilities 10,321 3,899 5,487 8,650 21,214 Labor hired 21,395 1,631 1,837 9,255 65,495 Livestock expense 34,139 1,516 1,681 5,450 114,715 Crop expense 160,476 50,728 97,384 163,106 300,755 Miscellaneous 4,529 1,592 2,171 3,818 9,601 Total cash operating expense $301,941 $80,317 $144,026 $251,633 $662,977 Cash rent $98,550 $18,975 $40,068 $97,665 $214,738 Property taxes 9,398 5,676 7,254 9,391 14,244 Insurance 22,046 7,551 12,342 21,560 42,600 Building repairs 8,861 2,621 4,365 6,037 20,312 Interest 37,698 7,124 18,218 28,279 87,513 Other overhead expenses 15,591 4,594 6,300 13,031 34,937 Total cash fixed expense $192,144 $46,541 $88,548 $175,962 $414,343 Feed purchased $131,700 $4,779 $8,241 $22,045 $440,800 Livestock purchased 104,858 541 5,723 14,460 356,945 Total cash expenses $730,643 $132,178 $246,539 $464,100 $1,875,065 Cash net farm income $85,097 $15,399 $65,334 $111,685 $133,084 Loans received minus loans repaid $1,238 -$2,010 -$10,720 $22,260 -$3,530 Net farm cash flow $86,335 $13,389 $54,614 $133,945 $129,554 Page 5 A more accurate measure of net farm income is achieved by netting out changes in the values of beginning and ending inventories, subtracting a depreciation charge for farm assets and including accrued income and expenses. A summary of income and expenses using accrual accounting is shown in Table 4. The 2019 accrual net farm income ranged from an average of $18,285 among the smallest farms to an average of $151,063 among the largest farms, and averaged $77,946 across all farms. The latter was the highest average accrual net farm income since 2014 ($99,177). Return to management, obtained after subtracting a return to unpaid labor and equity capital invested, was negative for all farm sizes and averaged -$31,252 in 2019. The most recent year when return to management was positive for the average farm was 2012 ($115,120). The operating expense ratio decreased by 1% while the net farm income ratio for the average Iowa farm increased by 1% in 2019. The interest expense ratio and depreciation expense ratio remained stable at 5% and 9%, respectively. Table 4. Summary of Accrual Income and Expenses by Size of Farm 1/ Average Total Value of Gross Sales $100,000 to $199,999 $200,000 to $399,999 $400,000 to $799,999 $800,000 and above Income Total cash income $815,740 $147,577 $311,873 $575,785 $2,008,149 Change in crop inventory 15,247 16,066 9,714 13,589 21,310 Change in livestock inventory -4,260 -369 4,391 -793 -18,422 Feed credits, change in other inventories 44,386 4,070 4,141 7,140 145,668 Total accrual income (gross revenue) $871,113 $167,344 $330,117 $595,722 $2,156,705 Total cash expenses $730,643 $132,178 $246,539 $464,100 $1,875,065 Depreciation 62,524 16,881 29,517 59,840 130,577 Total accrual expenses $793,167 $149,059 $276,056 $523,940 $2,005,642 Accrual net farm income $77,946 $18,285 $54,061 $71,782 $151,063 Charge for unpaid labor 29,311 21,338 26,735 30,616 36,628 Charge for equity capital (4%) 79,887 38,935 62,588 78,892 128,081 Return to management -$31,252 -$41,987 -$35,261 -$37,726 -$13,646 Allocation of gross revenue Operating expense 75% 75% 69% 73% 83% Interest expense 5% 4% 6% 5% 4% Depreciation expense 9% 10% 9% 10% 6% Net farm income 11% 11% 16% 12% 7% 100% 100% 100% 100% 100% The value of all crops and livestock produced on the farm is shown in Table 5. The value of farm production increased by 11% or $62,616, driven mainly by increases in the net value of livestock production, miscellaneous income, and crop inventory, to average $634,555 in 2019. Table 5. Value of Farm Production by Size of Farm 2/ Average Total Value of Gross Sales $100,000 to $199,999 $200,000 to $399,999 $400,000 to $799,999 $800,000 and above Value of livestock production $300,688 $5,424 $15,217 $40,106 $1,022,960 Less purchase for resale 104,858 541 5,723 14,460 356,945 Less purchased feed fed 131,700 4,779 8,241 22,045 440,800 Net value of livestock production 64,130 105 1,252 3,600 225,214 Value of crop production (incl. feed credits) 427,857 116,974 245,101 423,392 839,523 Miscellaneous income 127,320 28,879 60,086 118,635 272,913 Crop inventory change 15,247 16,066 9,714 13,589 21,310 Value of farm production $634,555 $162,024 $316,153 $559,216 $1,358,960 1/ Accrual net farm income = value of farm production - total cash fixed expense - total cash op erating expense - depreciation 2/ Value of farm production = gross revenue - livestock purchase for resale - purchased feed fed Page 6 Efficiency Factors Selected efficiency factors are shown in Table 6 for the four farm size groups. Gross revenue per person and per dollar of assets increase with farm size, while machinery cost per acre declines with farm size. The rates of return on equity and assets averaged 2.1% and 2.7%, respectively, across all farm groups. The average interest rate on debt ranged from 4.5% for the third group ($400,000 to $799,999 in gross sales) to 5.6% for the second group ($200,000 to $399,999 in gross sales), and amounted to 5.1% across all farms. Table 6. Overall Efficiency Factors by Size of Farm Total Value of Gross Sales Average $100,000 to $199,999 $200,000 to $399,999 $400,000 to $799,999 $800,000 and above Crops Acres in crops 674 224 412 691 1,246 Crop value per acre $606 $522 $595 $613 $674 Crop acres per person 399 281 414 536 355 Machinery cost per crop acre $145 $164 $143 $140 $137 Machinery investment per crop acre $497 $536 $463 $515 $484 Livestock Livestock returns per $100 feed fed $158 $173 $170 $131 $159 Financial Gross revenue per person $416,983 $209,726 $331,982 $462,540 $613,935 Gross revenue per $1 expense $1.13 $1.12 $1.20 $1.14 $1.08 Gross revenue per $1 assets $0.28 $0.17 $0.19 $0.25 $0.47 Value of farm production per $1 assets $0.22 $0.17 $0.18 $0.23 $0.29 Return on assets (ROA) 2.7% 0.4% 2.7% 2.9% 4.4% Return on equity (ROE) 2.1% -0.4% 2.0% 2.3% 4.0% Operating profit margin ratio (as % of gross revenue) 1/ 9.6% 2.4% 13.8% 11.7% 9.4% Operating profit margin ratio (as % of value of farm production) 11.5% 2.5% 14.4% 12.4% 14.9% Average interest rate on debt 5.1% 5.0% 5.6% 4.5% 5.1% 1/ (Accrual net farm income + interest - unpaid labor) / gross revenue High-, Middle-, and Low-profit Farms Profits vary greatly among farms. In Table 7, farms were ranked by return to management and sorted into three groups. The high third group was the one with the lowest machinery costs per acre and the highest income from government payments, inventory value gains, and income sources other than crop and livestock sales (Other income and inventory), and its return to management averaged $56,406 in 2019. This group also had the lowest net worth per acre farmed across the three groups. The middle third group had the lowest number of acres in crops, the smallest livestock sales and expenses, and its return to management averaged -$57,928. The low third group had the highest number of acres in crops, the highest machinery cost per crop acre, the highest income from crop and livestock sales, but the lowest revenue from “Other income and inventory,” and its return to management averaged -$207,288. However, their net worth per acre was the highest among the three groups, and their debt-to-asset ratio was the lowest. Page 7 High-, Middle-, and Low-profit Farms Table 7. Comparison of High-, Middle-, and Low-profit Farms, Ranked by Return to Management 1/ High Third Middle Third Low Third Your Farm Farm Income Crop sales $431,683 $370,257 $580,449 Livestock sales 455,522 164,263 485,385 Other income and inventory 202,321 146,560 55,215 Feed credits 62,514 23,473 79,893 Gross revenue $1,152,041 $704,553 $1,200,942 Operating expenses $367,019 $262,904 $447,627 Fixed expenses (incl. depreciation) 294,414 247,171 380,668 Feed purchased 194,352 66,785 221,961 Livestock purchased 136,430 80,318 175,055 Total expenses $992,215 $657,179 $1,225,312 Accrual Net Farm Income $159,825 $47,375 -$24,370 Operator and family labor charge $31,994 $28,603 $31,703 Charge for equity capital 71,426 76,700 151,216 Return to Management $56,406 -$57,928 -$207,288 Crops Acres in crops 792 618 966 Crop value per acre $624 $637 $684 Crop acres per person 337 472 518 Machinery cost per crop acre $130 $151 $158 Machinery investment per crop acre $436 $507 $632 Livestock Livestock returns per $100 feed fed $155 $139 $164 Value of Farm Production $821,258 $557,450 $803,925 Financial Gross revenue per person $490,360 $537,556 $644,446 Gross revenue per $1 expense $1.16 $1.07 $0.98 Gross revenue per $1 assets $0.47 $0.29 $0.26 Value of farm production per $1 assets $0.34 $0.23 $0.17 Return on assets (ROA) 7.0% 2.1% 0.1% Return on equity (ROE) 7.7% 1.1% -1.7% Operating profit margin ratio (as % of gross revenue) 1/ 0.15 0.07 0.01 Operating profit margin ratio (as % of value of farm production) 0.21 0.09 0.01 Debt-to-asset ratio 0.32 0.32 0.27 Net worth per acre farmed $2,100 $2,701 $3,495 Allocation of Value of Gross Revenue Operating expense 76% 80% 88% Interest expense 4% 5% 5% Depreciation expense 6% 9% 8% Net farm income 14% 7% -2% 1/ Values have not been adjusted for size of business. Page 8 Crop Production Details of crop production income and expenses per acre are summarized in Table 8. Some expenses, such as cash rent, did not occur on all farms or on all acres, but are shown as the average cost over all acres. Total economic costs include a 4% opportunity cost charge for the farm net worth capital, a depreciation charge, and a charge for operator and family labor. The numbers presented in Table 8 refer to simple, unweighted averages across all farms included in the Iowa Farm Business Association Summary Report. The selling price was lower than the total economic cost per bushel for both crops, and only higher than the total cash flow needed per bushel for corn. Table 8. Crop Production All Corn Soybean Total operator acres per crop 451 342 Yield, bushels per acre 199 57 Selling price per bushel $3.68 $8.42 Crop value per acre $734 $479 Crop Expenses per Acre Seed $110.76 $58.98 Fertilizer and lime 128.46 31.13 Herbicide 42.32 49.35 Insecticide 8.32 7.07 Drying and storage 22.61 3.62 Machinery, fuel, repairs, machine hire 86.86 78.97 Utilities 11.14 9.54 Insurance 28.65 27.47 Hired labor 10.65 9.12 Interest 40.18 37.19 Cash rent 130.14 126.77 Property taxes and building repairs 21.94 21.31 Other crop expenses 21.85 18.72 Total cash crop expenses per acre $663.87 $479.23 Machinery depreciation $57.04 $54.94 Building depreciation 14.58 13.17 Charge for equity capital 118.51 118.65 Unpaid labor value 47.69 45.60 Total economic cost per acre $901.68 $711.59 Total economic cost per bushel $4.53 $12.51 Total cash flow needed per acre $663.87 $479.23 Total cash flow needed per bushel $3.33 $8.43 Page 9 Trends Table 9 illustrates trends in production and financial efficiency over the past 10 years. Livestock income per $100 feed fed shows a cyclical pattern, and in 2019 it was 5% higher than the 10-year average. The average corn yield of 199 was the fifth highest ever, and 6% higher than the 10-year average. The rate of return to owned assets averaged 2.7% in 2019, or about two-thirds of the 10-year average, marking the seventh consecutive year of rates of return under 3%. Table 9. Trends in Production and Financial Efficiency on Iowa Farms Year Livestock Income per $100 Feed Fed Corn Yield Bushels per Acre Value of Farm Production per $1 Expense Crop Value per Acre Percent Return to Owned Assets 2010 149 174 1.52 584 7.6% 2011 135 172 1.71 671 10.6% 2012 1/ 102 149 1.68 882 10.6% 2013 145 169 1.19 821 2.2% 2014 223 184 1.20 667 2.5% 2015 2/ 133 200 1.09 588 1.1% 2016 117 209 1.12 635 1.7% 2017 3/ 179 214 1.08 604 1.5% 2018 161 201 1.12 617 2.2% 2019 158 199 1.13 606 2.7% 10-year average $150 187 $1.28 $667 4.3% 1/ Revised using weights from the 2012 Census of Agriculture. 2/ Revised with additional farm data. 3/ Revised using weights from the 2017 Census of Agriculture. Percent Return to Owned Assets Prepared by Alejandro Plastina extension economist, plastina@iastate.edu www.extension.iastate.edu/agdm store.extension.iastate.edu This institution is an equal opportunity provider. For the full non-discrimination statement or accommodation inquiries, go to www.extension.iastate.edu/diversity/ext . 2019 Iowa Farm Costs and Returns 2019 Iowa Farm Costs and Returns