/
THE OVERRATED IMPORTANCE OF STATISTICS IN RESEARCH  by  Dennis Roberts THE OVERRATED IMPORTANCE OF STATISTICS IN RESEARCH  by  Dennis Roberts

THE OVERRATED IMPORTANCE OF STATISTICS IN RESEARCH by Dennis Roberts - PDF document

tatyana-admore
tatyana-admore . @tatyana-admore
Follow
443 views
Uploaded On 2015-09-17

THE OVERRATED IMPORTANCE OF STATISTICS IN RESEARCH by Dennis Roberts - PPT Presentation

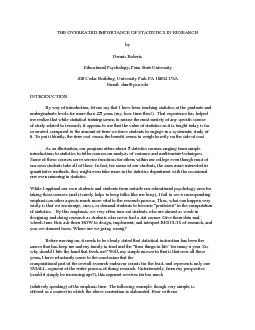
TYPICAL SIMPLE STUDY To lay out an example for discussion consider perhaps the simplest form of a true experiment where two levels of a treatment IV are given to groups of Subjects and one or mo ID: 131998

TYPICAL SIMPLE STUDY

Share:

Link:

Embed:

Download Presentation from below link

Download Pdf The PPT/PDF document "THE OVERRATED IMPORTANCE OF STATISTICS I..." is the property of its rightful owner. Permission is granted to download and print the materials on this web site for personal, non-commercial use only, and to display it on your personal computer provided you do not modify the materials and that you retain all copyright notices contained in the materials. By downloading content from our website, you accept the terms of this agreement.


Presentation Transcript

THE OVERRATED IMPORTANCE OF STATISTICS IN RESEARCH by Dennis Roberts Educational Psychology, Penn State University 208 Cedar Building, University Park PA 16802 USA Email: dmr@psu.edu By way of introduction, let me say that I have been teaching statistics at the graduate and undergraduate levels for more than 25 years (my, how time flies!). That experience has helped me realize that while statistical training seems to arouse the most anxiety of any specific course of study related to research, it appears to me that the value of statistics as it is taught today is far overrated, compared to the amount of time we force students to engage in a systematic study of it. To put it bluntly, the time cost versus the benefit seems to weigh heavily on the side of cost. As an illustration, our program offers about 5 statistics courses ranging from simple introductions to statistics to fuller courses on analysis of variance and multivariate techniques. Some of these courses serve service functions for others within our college even though most of our own students take all of these. In fact, for some of our students, the ones more interested in quantitative methods, they might even take more in the statistics department with the occasional one even minoring in statistics. While I applaud our own students and students from outside our educational psychology area for taking these courses (and it surely helps to keep folks like me busy), I fail to see a corresponding emphasis on other aspects much more vital to the research process. Thus, what can happen very easily is that we encourage, stress, or demand students to become “proficient” in the computation of statistics. By this emphasis, we very often turn out students who are almost as weak in designing and doing research as students who never had a stat course. Give them data and, wheels turn. But, ask them HOW to design, implement, and interpret RESULTS of research, and you see stunned faces. Where are we going wrong? Before moving on, it needs to be clearly stated that statistical instruction has been the source that has keep me and my family in food and the “finer things in life” for many a year. So, why should I bite the hand that feeds me? Well, my simple answer to that is that over all these years, I have reluctantly come to the conclusion that the computational part of the overall research endeavor counts for the least, and represents only one SMALL segment of the entire process of doing research. Unfortunately, from my perspective (could it simply be increasing age?), this segment receives far too much (relatively speaking) of the emphasis time. The following example, though very simple, is offered as a context in which the above contention is elaborated. Bear with me. TYPICAL SIMPLE STUDY To lay out an example for discussion, consider perhaps the simplest form of a true experiment where, two levels of a treatment (IV) are given to groups of Subjects and, one or more criterion tests are given (DV) after the experiment is finished. Now, assume that some student (hmmm, even a faculty member?) arrives at my office with “data in hand? for this “experiment” and is inquiring about “how do I analyze these data”? Has anyone out there had THIS situation confront you? Yes, probably many times. As it turns out, since the student was working in a school, the treatment levels were assigned to intact groups. In fact, it just so happened that the student knew a teacher who had two sections of a course and was willing to let the student use both; provided that students were NOT rearranged in any fashion. “Use them as they sit ... or not at all” was the word from the teacher. We know of course that pooling together and then randomly assigning to the two treatment groups creates “administrative problems”. Also, since only one teacher was involved, that teacher administered both methods: one to the experimental group and the control method too. At the end of the experiment, several measures were given to the students including a criterion achievement test and some attitudinal survey forms. Now, to some, the above might seem satisfactory as far as design and implementation are concerned but, for sure, there are some fatal flaws that NO t test or other statistical method will be able to overcome. What follows is a schematic, in verbal form, of the steps in the process of implementing a study as that described above along with some commentary as to where fatal or near fatal stumbling blocks might be encountered, STEPS IN TWO GROUP EXPERIMENT Key to conducting an internally and externally valid two group experiment would be to sample from the target population, to have equivalent groups at the beginning of the study, sufficient control of the conditions of the implementation of the treatments, and reasonable interpretation of the results. As a series of steps, we might consider the following. Keep in mind that the list below (adapted from Rabinowitz and Roberts, 1972) does not even include the issue of knowing the literature that impinges on the investigation at hand that might either suggest factors that are critical to control for in the student_s study or, which pitfalls to avoid at all costs. We know of course that far too much sloppy or inconsequential research is done MERELY because one (or the committee?) is not informed enough about the previous and/or relevant other work that has been done and reported. 1. Defining the Target Population 2. Obtaining a sample FROM the Target Population 3. Subdivision of the Sample INTO Two Groups 4. Implementation of levels of the Independent Variable 5.Using Reliable/Valid Measures when Collecting Criterion Dependent Variable Data6. Doing Appropriate Analyses 7. Engaging in Reasonable Interpretations of the Data WHERE THINGS CAN GO WRONG A. While the task of defining the target population to which you would hope to generalize your results should be a relatively easy one, it becomes rather clear when looking at WHERE the sample came from that either the investigator really does not know WHO the target population is or has had a very difficult time selecting a sample that fits the definition of the target population. What do you see in this case? Not uncommon would be to say that the study is designed to see whether some new method of instruction works better for secondary school students (than some old method) but, the sample consists only of tenth grade students. Was their target population really all secondary students or only tenth grade students? Even if the target population were renamed “tenth grade students”, chances are BETTER than 50/50 that they came from some LOCAL school system; ie, it was much more convenient to sample that way. Besides, who has money to travel all over the country? Serious Problem 1: A failure to representatively sample from the target population could easily mean that your inference about the impact of the results might be wrong. B. For the sake of argument, let_s assume that the two classes used in the above experiment, in total, happen to be a very good cross-section from the target population. But, now comes the critical phase of assigning either the students to the treatment levels, or treatment levels to the students. Let_s further assume that the treatments are such that the TEACHER has to implement them; we cannot merely embed the different treatments in packets of paper and pencil materials. Since the co-operating teacher has told you that all students in each class must stay together, you merely flip a coin and decide which group gets which treatment level, Unfortunately, the lack of control of the assignment of the treatment to the Subjects can very easily mean that one group is more capable than the other at the start of the experiment. If the DV data favors the experimental group, how does one know that the difference between the two groups was not simply a reflection of the initial difference between the groups? Well, some might argue that in situations like this, we should always give a pretest first. Unfortunately again, this does not solve the problem. First, the fact that the two groups might be equal at the beginning does not equate to after the fact random assignment to the treatment groups. They could be different in many other ways that impact on the DV. Second, some argue that statistical methods like analysis of covariance will solve this problem but, I hate to break the news: ANCOVA also assumes random assignment to the groups. In fact, ANCOVA makes MORE assumptions about the nature of the data, not fewer. And third, in some situations, the administration of a pretest actually will sensitize the Subjects to being more receptive of the treatments that would not be evident if NO pretest were given. Serious Problem 2: The heart of internal validity hinges on the assumption that any difference in the DV at the end of the study is a result of the IV or treatment. The fact that the groups might be inherently different at the beginning, due to lack of control over the assignment to the treatment levels, is a fatal flaw of the ilk from which no statistical technique is capable of saving you. Even if the above two problems were completely avoided, one also has to face the fact that the treatment is beneficial but, the overall impact of the treatment is very small. Thus, what we are hoping to find is a difference that is minuscule but real. So, what happens if you do not have access to very many Subjects in your study? Well, most of us are TOO familiar with sampling error and, the impacts of n on sampling error. In the above case, given the magnitude of the true treatment effect, the size of the sample might be unrealistically small to let mean differences overcome sampling error. Hence, we have a problem of power. Of course, this is a statistical matter and, attempts can be made before conducting the study to estimate what size of a sample you might need to “uncover” a true effect of a certain magnitude. But, when was the last time you tried to realistically get a student to do this? (Or a faculty member doing their own research). The trend seems to be to retroactively try to estimate power and then to plead the case that it was POWER THAT WAS AT FAULT! Sure, hindsight is always a way to justify your result. Serious Problem 3: We usually seriously overestimate how large the impact of our IV will be and therefore seriously underestimate how many Subjects we need. Too small of a sample size when the real impact of an IV is small is a surefire method for NOT finding what you are looking for. When we implement an experimental study like that described above in ONE school, it is bound to be the case that kids who are in one class will talk to kids who are in another class. In the present case, the teacher has both classes and, it is very possible that the students would eat lunch together or would be in contact with one another at other times. So, when this happens, kids from the experimental class will invariably talk about what is going on and, kids from the control condition will not only say that they are doing or NOT doing, they might ABSORB some of what was supposed to be restricted to the experimental Subjects alone. Thus, the treatment condition seeps over to the control condition. If no difference is found at the end, we say that the treatment had no effect but, it might possibly be that it had a good effect but, in BOTH experimental and control groups thus rendering them as look alikes. Another problem here could be that even with pre study training, it might be impossible for the one teacher to keep separate what he/she is supposed to do in the experimental condition distinct from he/she is supposed to do in the control condition. After all, they might ALL be his/her students and would not want any of them to look bad at posttest time. While maybe not done consciously, it sill might yield a teacher behavior that tries to counteract what the experimental group gets with working harder with the control Subjects. Things happen. Thus, again, differences or lack of differences could be unrelated to the treatment but rather, lack of ability of the administrator OF the treatments to keep treatments separate and distinct. Serious Problem 4: Lack of keeping treatment from flowing into the control group and/or failure of the giver of the different treatments from faithfully adhering to those differences can easily produce differences or lack of differences in DV unrelated to the real impact of the treatment. E.Far too often when we plan studies, we look for measures in the literature that will “fit” our needs. In the case above, it is implied that the investigator needs some cognitive measure of achievement and one or more affective measures to assess perhaps attitudes. Thus, the search is on: do you have something I can use for my study? I need a measure of math fractions and an attitude scale about “attitudes about mathematics”? Well, as it goes, there may be numerous measures SIMILAR to what you need but, are they really SPECIFICALLY APPROPRIATE to what you are doing? Unfortunately, building good measures of outcomes that are appropriate (reliable and valid) for your study take time and perhaps one or more pilot studies just to get the measures part of your investigation straight. Given the pressures of time, far too often we simply take what SEEMS to be satisfactory but, when one more closely inspects what is being measured, it might not be what you really need. Though treatments tend to be rather specific, many of the measures that you “borrow_ tend to be too broad to be sensitive to the treatment details. Thus, too often, readily available measures are not sensitive enough to what your treatments are trying to accomplish and therefore, differences between experimental and control groups are harder to find. Unless it is clear cut, most available measures will not be sufficient to fill your investigation needs. Serious Problem 5: Use of readily available instruments will more than likely reduce the chance that your study will find the results you are actually looking for. At this point, we come to the actual data analysis. In the present case, the most likely analysis would be to compare the means between the two groups on one or more measures. While not getting into the notion that there are many ways to look at these data, we would assume that someone would do a simple t test and report the results. This is about as straightforward as one can get. But, of course, even the lowly simple t test assumes random assignment and, as we see from the above, that did not happen. So, what would a significant t tell you in this case when the most CRITICAL assumption has clearly been violated? Not much, I am afraid. The t-test and p-values are only relevant as devices to sanction your extrapolation from the sample to the target population. I have seen some try to fudge this part by saying: the means in the populations from which THESE samples were drawn are probably not the same but, then this becomes a test of whether the populations are the same and not one of does the treatment have the same impact. In this setting, you are in a whole passel of trouble. Of course, there are other instances when one might simply do the inappropriate test. What if the above had been a random assignment case with pretest and posttest. Well, what if the person does a t test on the DIFFERENCE between pretest and posttest for experimental and control groups SEPARATELY, and finds a significant t for the experimental but not for the control? Is it valid to assume a difference in the treatments? No! One needs to do a SINGLE t on the two difference scores. In the former case, it is possible that the experimental group was just BARELY significant whereas the control was just barely NON significant but, the difference between the two differences is trivial. This latter case could be easily corrected whereas the use of the t test when groups were not formed via random assignment is not a correctable error. Serious Problem 6: Sometimes, a test will be easily fixable if one did something incorrectly but, the basic assumptions underlying the correct test are intact. However, sometimes a test is used in a situation where the basic assumptions of the test have clearly been violated; especially where groups have not been formed via random assignment. Interpretations of results from cases like this are usually highly suspect. Finally, we arrive at the stage where one examines all the data and then has a stab at saying what it all means. In short, we interpret the data and perhaps try to integrate these data into the theory one posited to be operating in the present context and/or relate the findings to other findings reported in the literature. Here we have the classic case of OVERinterpreting the findings to the hilt always trying to stretch the data to support our view. A good example of this would be when conducting a correlational study say between reported hours of study that students spend and the grades of those same students in those courses. A positive correlation would be taken as evidence that IF YOU INCREASE THE NUMBER OF HOURS STUDIED, then grades should go up. In fact, one could increase the X variable to the point that the Y variable would be predicted to be larger than 4.0! The basic problem with this interpretation is that the researcher had NO control over the situation and therefore is not justified in making the causative leap. Drawing cause and effect inferences from data where there was no built in characteristic of gathering the data that would allow such interpretations is commonplace. Serious Problem 7: Most results are over interpreted, and in favor of one_s own position or view of HOW the findings should be. Everyone wants to do a piece of research that has sweeping value in all reaches of a field. Unfortunately, this is very rarely the case, due to the inherent limitations of the research design and execution. Beginning researchers need to appreciate that fact and not embarrass themselves by over-interpreting their findings. WHAT DO THESE THINGS HAVE TO DO WITH STATISTICS? For the most part, the problems identified above have little to do with FORMAL statistical analysis: its theory and techniques. The problems that are commonplace in even the simplest of investigations are ones that statistical techniques cannot solve. To the best of my knowledge, no statistical salvo will save us from failing to start experimental groups off at the same point. Also, how can ANY statistical technique repair the fact that the investigator let the Subjects in the experimental treatment group freely associate with those Subjects in the control group thus losing the treatment integrity that a study demands. A classic case of this was with much of the calculator research where groups were compared who either had or did not have access to the use of a calculator when doing their math work (Roberts, 1980). While the controls Subjects might not have had access to the use of calculators during their MATH CLASS, there was nothing to prevent them from using and benefiting from calculator use OUTSIDE of class thus reducing the potential for demonstrating that calculators actually make a difference. The conclusion I draw from all these years of helping students and even other faculty design and implement and interpret their research is that it is RARELY the formal statistical analysis part that gets in the way of VALID conclusions being extracted from the data. To put it simply: it is usually an error of design or implementation that messes things up, not how we handle the data. [suggestion: underline the phrase after the colon for emphasis. I think this is the key message] When you look at bad research, it typically IS bad because it failed to sample appropriately, or assign Subjects to groups appropriately, or failed to control the implementation of the treatments, or failed to use good criterion measures or finally, made claims in the discussion section that simply cannot be supported by the DATA THAT WERE COLLECTED. Thus, in my mind, screwing up the statistical part is rarely the culprit in research that is done poorly. Sometimes major goofs do happen at the analysis stage but, they pale in comparison to the other sources of potential miscues. WHAT CAN BE DONE? Fundamentally, I think that those who will be engaging in and/or interpreting research, need far more instruction and homework in the components of research that are NON computational. For example, I would place far more practice on doing literature searches on specific topics to isolate critical variables that need to be considered/controlled in given research settings. I would also have students practice building criterion measures where the emphasis was on constructing a scale (if that is appropriate) that gets at what you are trying to assess: ie, try the tactic of building instruments rather than just “finding” them. Students would also practice sampling in projects to see that bad sampling easily leads to bad generalizations. Also, I would have students spend much more time on DESIGN rather than computation of collected data. Far too few students and faculty really realize how you go about planning and designing a study that will give you the best chance of finding first, what you are looking for but second, finding things of importance. I think it is time for a change. CLOSING NOTE I have had contacts with people who feel that a good statistician is one who has all these elements down pat. A good statistician knows good design, and good implementation strategies, and good measurement practice, and all the rest. Well, I wish I could believe that. My own view is that even in programs at the doctoral level in statistics, the emphasis is far to great on THEORIES and TECHNICAL PROCEDURES. Thus, the same types of concerns that I have indicated above still can easily permeate a pure statistician_s advice since, he/she is heavy on details of procedures but light on practical ramifications of poor design and implementation. And, in areas like psychology or education, where there perhaps is even less attention to components of research other than statistical methods, the situation perhaps is even worse. Finally, for sure, even if a person is expert in design and implementation and analysis, it is highly unlikely that he/she will understand or know the critical literature that impinges on almost all studies for which he/she might be asked to consult. Thus, regardless of the research skills of the statistician, there will always be the need for the doer of the research to have the BEST handle on the previous work that has been done that should impact how the study is designed and executed. Thus, while statistical training is important] and I would never advocate NOT spending time in that pursuit, there are pursuits of substantially more consequence than simply taking one statistics course after another. If we want better research, we need to admit that taking more and more statistics courses will not accomplish that. Rabinowitz, W. R. and Roberts, Dennis M. (1972) Common flaws in research design. NABTE Review, 4, 5- Roberts, Dennis M. (1980). The impact of calculators on educational performance. Review of educational research, 50(1), 71-