/
YOUR LIMB LOSS/LIMB IMPAIRED BENEFICIARIES YOUR LIMB LOSS/LIMB IMPAIRED BENEFICIARIES

YOUR LIMB LOSS/LIMB IMPAIRED BENEFICIARIES - PowerPoint Presentation

tatyana-admore
tatyana-admore . @tatyana-admore
Follow
377 views
Uploaded On 2018-03-08

YOUR LIMB LOSS/LIMB IMPAIRED BENEFICIARIES - PPT Presentation

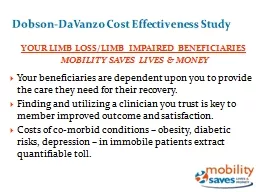
MOBILITY SAVES LIVES amp MONEY Your beneficiaries are dependent upon you to provide the care they need for their recovery Finding and utilizing a clinician you trust is key to member improved outcome and satisfaction ID: 643697

davanzo cost amp study cost davanzo study amp effectiveness care costs dobson patients orthoses medicare prosthetic limb extremity findingslower

Share:

Link:

Embed:

Download Presentation from below link

Download Presentation The PPT/PDF document "YOUR LIMB LOSS/LIMB IMPAIRED BENEFICIARI..." is the property of its rightful owner. Permission is granted to download and print the materials on this web site for personal, non-commercial use only, and to display it on your personal computer provided you do not modify the materials and that you retain all copyright notices contained in the materials. By downloading content from our website, you accept the terms of this agreement.


Presentation Transcript

Slide1

YOUR LIMB LOSS/LIMB IMPAIRED BENEFICIARIES MOBILITY SAVES LIVES & MONEYYour beneficiaries are dependent upon you to provide the care they need for their recovery. Finding and utilizing a clinician you trust is key to member improved outcome and satisfaction.Costs of co-morbid conditions – obesity, diabetic risks, depression – in immobile patients extract quantifiable toll.

Dobson-DaVanzo Cost Effectiveness Study

1Slide2

CASE FOR O&P CARE BUILDSOctober, 2013 NEJM article demonstratively proved favorable impact of orthotic braces for scoliosis.Colorado state study showed costs of O&P more than offset by savings.An entry level Masters requirement raises the bar on training/expertise.Ten dedicated schools assuring optimal expertise of trained professionals.Dobson-DaVanzo Cost Effectiveness Study

2Slide3

WHAT’S NEW? - O&P CARE SAVES $$$O&P clinicians are educated, experienced, and a valued resource to the physicians for all aspects of care for mobility-impaired patients.The Dobson-DaVanzo Study demonstrates the value of your payment in terms of both patient recovery and cost savings.Dobson-DaVanzo

Cost Effectiveness Study

3Slide4

O&P CARE IS NOT A COSTERFor the First Time Solid Empirical Data Demonstrates that O&P Care is Cost Effective—Generally Saving Payers Money and Is Not a Coster.Dobson-

DaVanzo Cost Effectiveness Study

4Slide5

5Dobson-DaVanzo Cost Effectiveness StudySlide6

Cost Effectiveness of Orthotic & Prosthetic Interventions in Reducing Total Medicare Expenditures A study conducted using, with the permission of the Medicare system, a custom cohort database of Medicare by Dobson-DaVanzo Commissioned by the Amputee Coalition, with grant support from the American Orthotic & Prosthetic Association

Dobson-

DaVanzo Cost Effectiveness Study

6Slide7

7Dobson-DaVanzo Cost Effectiveness Study

O&P DELIVERS ROI TO PAYERS WITHIN 12-18 MONTHS

In addition to economic comparisons of the costs of their Medicare services, indicators of enhanced recovery, risk reduction and lifestyle factors were also examined. The hypothesis was that the cost of treatment would be cost justified thus providing the payer a return on his investment.Slide8

8Dobson-DaVanzo Cost Effectiveness Study

ALL HEALTH COSTS OVER 4 YEARS

THOSE RECEIVING O&P CARE VS. THOSE WHO DIDN’T The study analyzed the Medicare Claims database for patients with similar diagnoses. Possible treatment pathways included the provision of lower limb

orthoses

, spinal orthoses, and lower limb prostheses or no intervention.

The research design separated patients into two groups for each of the three therapies. One group received treatment. The other did not. The study determined their cost history for medical care following O&P intervention versus costs for those not receiving treatment.Slide9

9Dobson-DaVanzo Cost Effectiveness Study

Lower Limb Orthoses & Spinal Orthoses

The conclusions for both orthotics cases show the cumulative Medicare costs over the 18 months following receipt of the orthotic intervention were less than the population that did not receive the treatment.Slide10

10Dobson-DaVanzo FindingsLower Extremity

OrthosesSlide11

11Dobson-DaVanzo FindingsLower Extremity

OrthosesSlide12

12Dobson-DaVanzo FindingsSpinal

OrthosesSlide13

13Dobson-DaVanzo FindingsSpinal

OrthosesSlide14

14Dobson-DaVanzo Cost Effectiveness Study

Lower Limb Prostheses With respect to the prosthetic intervention, the cumulative cost comparison demonstrated that the cohort that received the prosthesis had about

1% higher costs compared to the population that did not receive the device. The slope of the cumulative cost curve indicates that had the period of evaluation been longer the break- even would have been reached.Slide15

15Dobson-DaVanzo FindingsLower Extremity ProsthesesSlide16

16Dobson-DaVanzo FindingsLower Extremity ProsthesesSlide17

17Dobson-DaVanzo FindingsLower Extremity ProsthesesSlide18

18Dobson-DaVanzo Cost Effectiveness Study

QOL, INDEPENDENCE ↑AT NO NET PAYER COST The prosthetic patients could experience better quality of life and increased independence compared to patients who did not receive the prosthetic at essentially no additional cost to Medicare or to the patient. Slide19

19Dobson-DaVanzo Cost Effectiveness Study

MEDICARE DATA PROVES O&P VALUE

These conclusions are extraordinarily significant in that for the first time actual data prove the value of an O&P intervention based on economic criteria. In addition, there are other soft benefits in the form of quality of life, enhanced mobility and the opportunity to more fully participate in earning a living and enjoying life. Slide20

DATA REBUTS ASSUMPTION THAT HIGHER K-LEVELS COST MORE Looking forward to working together to understand other outstanding benefits of identified issues and findings. (K1/K2 vs. K3/K4)K Levels – Medicare’s way to define potential amputee mobility. (K1 Lowest to K4 Highest)Dobson-

DaVanzo Cost Effectiveness Study

20Slide21

PATIENTS WITH LESS ADVANCEDPROSTHESES (K1 & K2) COST PAYERS MOREK3/K4 – Involves larger upfront investment in prosthesis.Data shows K1/K2 patients have higher total healthcare costs, more occupational & physical therapy, and larger reliance on SNF and home health care compared to K3/K4 patients. (Despite K3/K4’s higher prosthetic costs)

Further Study Being PursuedDobson-DaVanzo

Cost Effectiveness Study

21Slide22

MORE TO COME Stay tuned for additional value ideas on clinical scenarios and the accompanying positive reimbursement benefits.Dobson-DaVanzo Cost Effectiveness Study

22