/
510(k) SUBSTANTIAL EQUIVALENCE DETERMINATION 510(k) SUBSTANTIAL EQUIVALENCE DETERMINATION

510(k) SUBSTANTIAL EQUIVALENCE DETERMINATION - PDF document

tawny-fly
tawny-fly . @tawny-fly
Follow
434 views
Uploaded On 2017-02-20

510(k) SUBSTANTIAL EQUIVALENCE DETERMINATION - PPT Presentation

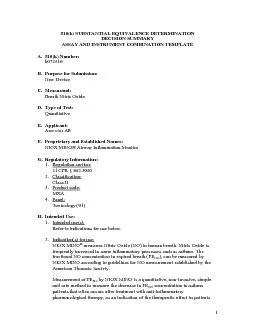
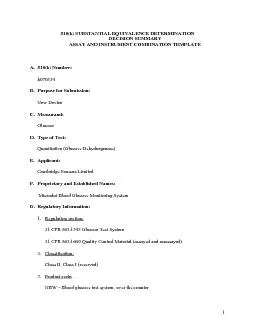
DECISION SUMMARY ASSAY AND INSTRUMENT COMBINATION TEMPLATE A 510k Number k070524 B Purpose for Submission New Device C Measurand Glucose D Type of Test Quantitative Glucose Dehydro ID: 517851

DECISION SUMMARY ASSAY AND INSTRUMENT

Share:

Link:

Embed:

Download Presentation from below link

Download Pdf The PPT/PDF document "510(k) SUBSTANTIAL EQUIVALENCE DETERMINA..." is the property of its rightful owner. Permission is granted to download and print the materials on this web site for personal, non-commercial use only, and to display it on your personal computer provided you do not modify the materials and that you retain all copyright notices contained in the materials. By downloading content from our website, you accept the terms of this agreement.


Presentation Transcript

510(k) SUBSTANTIAL EQUIVALENCE DETERMINATION DECISION SUMMARY ASSAY AND INSTRUMENT COMBINATION TEMPLATE A. 510(k) Number: k070524 B. Purpose for Submission: New Device C. Measurand: Glucose D. Type of Test: Quantitative (Glucose Dehydrogenase) E. Applicant: Cambridge Sensors Limited F. Proprietary and Established Names: Microdot Blood Glucose Monitoring System G. Regulatory Information: 1. Regulation section: 21 CFR 862.1345 Glucose Test System 21 CFR 862.1660 Quality Control Material (assayed and unassayed) 2. Classification: Class II, Class I (reserved) 3. Product code: system, over the counter 1 LFR – Glucose dehydrogenase, glucose JJX – Single (specified) analyte controls (assayed and unassayed) 4. Panel: 75, Clinical Chemistry H. Intended Use: 1. Intended use(s): See indications for use below 2. Indication(s) for use: microdot Blood Glucose Monitoring System The microdot Blood Glucose Monitoring System is or by health care professionals in home microdot Blood Glucose Meter The microdot Blood Glucose Meter is intended for the quantitative measurement of e blood from a fingerstick. It is intended for use by persons with diabetes or by health care professionals in home settings or healthcare facilities. It is microdot Test Strips The microdot® Test Strips are intended for the quantitative measurement of glucose in fresh capillary whole blood from a fingersti microdot Control solutions The microdot® Control solutions are intended for use with microdot® Blood Glucose microdot® Blood Glucose Monitoring System is intended for over the counter use. 3. Special conditions for use statement(s ): 2 For over-the-counter use. Not for use with newborn patients. 4. Special instrument requirements: Microdot blood glucose monitor I. Device Description: The microdot Blood Glucose Monitoring System consists of the microdot Blood Glucose Meter, microdot Test Strips, microdot Control Solutions and a commercially available calibrated to give plasma equired into the meter manually by using the meter buttons. The meter is turned on test strip and the meter starts the measurement. After 10 seconds, the meter displays the glucose concentration and time and date on the LCD display. J. Substantial Equivalence Information: 1. Predicate device name(s): One Touch Ultra blood glucose monitoring system Senova Blood Glucose monitoring system Senova control solutions 2. Predicate 510(k) number(s): k002134 k032076 k032819 3. Comparison with predicate: Similarities Item Device (Microtdot) Predicate (One Touch Ultra) Predicate (SeNova) Sample Fresh Capillary whole blood Fresh Capillary Fresh Capillary Calibration Plasma Plasma Plasma 3 Similarities Item Device (Microtdot) Predicate Predicate (One Touch (SeNova) Ultra) equivalent equivalent equivalent Sample volume 600 nanoliters microliter 600 nanoliters Control Solutions 3 levels 1 level 3 levels Differences Item Device (Microtdot) Predicate (One Touch Ultra) Predicate (SeNova) Test range 20-525 mg/dL 20-600 mg/dL 20-600 mg/dL Test time 10 seconds 5 seconds 10 seconds Hematocrit Range 30-50% 30-55% 20-60% K. Standard/Guidance Document Performance of Clinical Chemistry devices earity of Quantitative Analytical Methods CLSI Guideline EP7-A – Interference testing in Clinical Chemistry d Bias Estimation Using Patient Samples ISO15197 in vitro diagnostic test systems- requirements for blood-glucose monitoring systems for self testing in managing diabetes mellitus L. Test Principle: The test is base on the enzymatic conversion glucose in the sample to gluconolactone, with concomitant reduction of the enzyme cofactor re-oxidised to NAD+ by the mediator compound which in turn becomes reduced; re-oxidation of the mediator by the meter induces a micro current to flow, and the size of this micro to the amount of glucose in the sample. M. Performance Characteristics (if/when applicable): 1. Analytical performance: a. Precision/Reproducibility: Within-run precision was tested with two te 4 glucose concentration was obtained by athe required concentration was reached. Twenty replicate glucose measurements were carried out for each concentration in one day. Results are summarized in the table Summary of results for within run Precision / mg/dL Strip Lot no YSI 2300: 296 mg/dL 197 mg/dL 124 mg/dL mg/dL mg/dL mg/dL 297 189 121 78 46 Std Dev 11.03 7.93 3.89 3.21 2.66 CSL-5B2301 %CV 3.71 4.20 3.23 4.13 5.74 mg/dL 285 189 120 81 49 Std Dev 8.26 5.51 3.98 3.23 2.67 5E1801 %CV 2.90 2.91 3.31 4.01 5.48 concentration levels. Ten meters were usedeach meter daily for 10 days. The results are summarized in the table below. Summary of results for between run Precision / mg/dL Strip Lot No CSL - 5L1901 Control solution Mean St Dev %CV Low 45 2.45 5.42 Normal 117 5.78 4.96 High 371 18.12 4.89 b. Linearity/assay reportable range: assay is from 20 mg/dL to 525 mg/dL. The linearity study measured spiked whole blood samples with the microdot device using two test ear regression was performed resulting in a 2 = 0.997) for batch 5L1091 and a slope of 0.940 (r 2 batch 5L2001. Additional samples were performed in a second study to verify performance at concentrations down to 20 mg/dL and showed no bias between the microdot device and the YSI an c. Traceability, Stability, Expected valu The control solutions are prepared at three target concentrations by gravimetric addition of glucose to an aqueous matrix. The glucose concentrsolutions are verified with the YSI reference method. 5 Expected values for the control solutions are verified for each manufactured lot of d controls have a 24-month shelf life and are stable for 3 months after first use. d. Detection limit: The detection limit is 20 mg/dL. Measurement of samples down to 20 mg/dL showed no bias between the microdot device and the e. Analytical specificity: Effect of hematocrit over the range of 30 to 50% was tested at nominal glucose concentrations of 30, 60, 150, and 400 mg/dL. Testing was performed with two strip batches and each sample was measured n=6 with each test strip batch and compared to the YSI value for the samples (YSI showed no bias due to hematocrit). The results are summarized below: Hematocrit Interference results Nominal Sample 30 mg/dL Hematocrit % 30 40 51 YSI/mg/dL 36 36 35 microdot mg/dL ABS microdot mg/dL ABS microdot mg/dL ABS Reading 1 39 3 3 33 -3 3 29 -6 6 2 36 0 0 35 -1 1 27 -8 8 3 36 0 0 32 -4 4 31 -4 4 4 40 4 4 31 -5 5 32 -3 3 5 35 -1 1 32 -4 4 34 -1 1 6 37 1 1 30 -6 6 28 -7 7 Mean 37.17 1.17 1.50 32.17 -3.83 3.83 30.17 -4.83 4.83 Std Dev 1.94 1.72 2.64 %CV 5.22 5.35 8.75 6 Nominal Sample 60 mg/dL Hematocrit % 30 41 51 YSI/mg/dL 60 60 59 microdot mg/dL ABS microdot mg/dL ABS microdot mg/dL ABS Reading 1 67 7 7 61 1 1 56 -3 3 2 65 5 5 61 1 1 57 -2 2 3 64 4 4 60 0 0 55 -4 4 4 66 6 6 61 1 1 57 -2 2 5 63 3 3 60 0 0 53 -6 6 6 64 4 4 60 0 0 54 -5 5 Mean 64.83 4.83 4.83 60.5 0.5 0.5 55.33 -3.67 3.67 Std Dev 1.47 0.55 1.63 %CV 2.27 0.91 2.95 Nominal Sample 150 mg/dL Hematocrit % 30 40 50 Mean YSI/mg/dL 162 162 161 microdot Bias % ABS microdot Bias % ABS microdot Bias % ABS Reading 1 174 7.41 7.41 159 -1.85 1.85 142 -11.80 11.80 2 165 1.85 1.85 159 -1.85 1.85 140 -13.04 13.04 3 191 17.90 17.90 166 2.47 2.47 141 -12.42 12.42 4 181 11.73 11.73 151 -6.79 6.79 136 -15.53 15.53 5 178 9.88 9.88 149 -8.02 8.02 142 -11.80 11.80 6 173 6.79 6.79 162 0 0 134 -16.77 16.77 Mean 177 9.26 9.26 157.67 -2.67 3.5 139.17 -13.56 13.56 Std Dev 8.74 6.5 3.37 %CV 4.94 4.12 2.42 7 Nominal Sample 400 mg/dL Hematocrit % 30 40 50 YSI/mg/dL 303 405 399 microdot Bias % ABS microdot Bias % ABS microdot Bias % ABS Reading 1 355 17.16 17.16 424 4.69 4.69 395 -1.00 1.00 2 345 13.86 13.86 417 2.96 2.96 348 12.78 12.78 3 323 6.60 6.60 445 9.88 9.88 369 -7.52 7.52 4 317 4.62 4.62 439 8.40 8.40 367 -8.02 8.02 5 340 12.21 12.21 426 5.19 5.19 373 -6.52 6.52 6 354 16.83 16.83 410 1.23 1.23 378 -5.26 5.26 Mean 339 11.88 11.88 426.83 5.39 5.39 371.67 -6.85 6.85 Std Dev 15.86 13.17 15.33 %CV 4.68 3.08 4.13 concentrations. Each of these glucose concentrations was then spiked with the interfering compound at two concentrations to make the interference samples. Control samples were each spiked with the solvents used to make the interfering samples. No Interference effects were observed from the common interfering compounds shown below. No interfthe interfering sample and the control sample. Acetaminophen- up to 20 mg/dL Ascorbic acid – up to 3 mg/dL Dopamine – up to 13 mg/dL Triglycerides- up to 3000 mg/dL Cholesterol – up to 500 mg/dL Bilirubin – up to 20 mg/dL Uric acid – up to 20 mg/dL Tolbutamide – up to 100 mg/dL L-Dopa – up to 5 mg/dL The microdot Blood Glucose Monitoring System was not tested at altitudes above sea level. Temperature and humidity studies were performed and showed that the device can be used from 10°C to 40°C and from 10% to 90% relative humidity. 8 f. Assay cut-off: Not applicable 2. Comparison studies: a. Method comparison with predicate device: The method comparison study was performed with 121 capillary fingerstick patient samples. In order to fully cover the measuring range, 19 of the samples were spiked The samples ranged in concentration from 36 to 473 mg/dL on the microdot device and met the ISO 15197 sample distribution requirements. Samples were measured incrodot meter and in 2 within the ISO 15197:2003 accuracy criteria of 95% of samples with ±15 mg/dL bias for glucose samples 75 mg/dL and ±20% bias for glucose sam�ples 75 mg/dL. System accuracy results for glucose concentrations g/dL Within ± 5 mg/dL Within ± 10 mg/dL Within ± 15 mg/dL 17/20 (85%) 20/20 (100%) 20/20 (100%) System accuracy results for glucose concentrations 75 mg/dL Within ± 5% Within ± 10% Within ± 15% Within ± 20% 40/101 (46%) 75/101 (74%) 92/101 (91%) 98/101 (97%) b. Matrix comparison: Not applicable 3. Clinical studies : a. Clinical Sensitivity: Not applicable b. Clinical specificity Not applicable c. Other clinical supportive data (when a. and b. are not applicable Not applicable 9