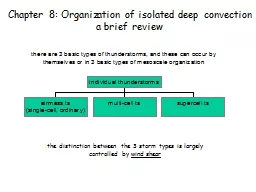
a brief review the distinction between the 3 storm types is largely controlled by wind shear 81 The role of wind shear bulk Richardson number weak shear strong shear Fig 81 Fig 82 81 The role of wind shear ID: 422831
Download Presentation The PPT/PDF document "Chapter 8: Organization of isolated deep..." is the property of its rightful owner. Permission is granted to download and print the materials on this web site for personal, non-commercial use only, and to display it on your personal computer provided you do not modify the materials and that you retain all copyright notices contained in the materials. By downloading content from our website, you accept the terms of this agreement.
Slide1
Chapter 8: Organization of isolated deep convectiona brief review
the distinction between the 3 storm types is largely controlled by
wind shearSlide2
8.1 The role of wind shear
bulk Richardson number:
weak shear
strong shear
Fig. 8.1
Fig. 8.2Slide3
8.1 The role of wind shear
no shear
strong shear
quicktime movies:Slide4
8.1 The role of wind shear
Weisman: convective storm matrix: buoyancy-shear dependencies. COMET-MetEd module
blue contour:
q
v
’=-0.2K near surface
red contour: w (10 m s
-1
) at 4 km
green: qr+qs+qg > 1 g kg-1 at 1 km
arrows: storm-relative flow
weakshear
strong
shear
Wilhelmson-Klemp (1982) sounding
(CAPE=2200 J kg
-1
)
Fig. 8.3
no shear
strong shearSlide5
Brief history of thunderstorm field research
’48-’49: Thunderstorm Project (Byers & Braham)’55: creation of the NSSL to develop weather radars and other instruments to better observe thunderstorms (Kessler)
’72-’76: NHRE (hail, hail suppression)’78: NIMROD (microbursts) (Fujita)’79: SESAME’82: CCOPE ’84: JAWS’87: PRESTORM (squall lines, MCSs)’90: COHMEX’95,’97: VORTEX (tornadoes)
’02: IHOP (convective initiation, low-level jet)
’04: BAMEX
07: COPS
’09-’10: VORTEX-IISlide6
The Thunderstorm Project
Early field project: summer 1946 in Florida, July 1947 in OhioJustified in part by need for wx information for the expanding aviation industryTen military aircraft, P61C (“Black Widow”), five each mission, spaced at 5000’ intervalsUsed new radar developments from WW-II (first use of 5 cm C-band radars)First meso-net (people recording wx at 5 min intervals during IOPs)
In-flight data obtained from photographs of instrument panelsfocused on determining kinematic and thermal structure and evolution of thunderstormsSlide7
The Thunderstorm Project : thunderstorm stages
References:the project report: “The Thunderstorm”Byers and Braham, 1948: Thunderstorm structure and circulation. J. Meteorol., 5, 71-86
Thunderstorm described as composed of a number of relatively independent cellsEach cell evolves through stages:“cumulus” stagemature stagedissipating stageSlide8
The cumulus stage:
Updrafts throughout, ~ 5 m/s max (15 m/s peak); no downdrafts
Cell sizes: 2-6 km
Updraft increases with height but diameter remains about constant (
entrainment).
LL convergence
Positively buoyant throughout
Graupel and rain in-cloud
15-30 min in duration
Wind, temperature, and hydrometeorsSlide9
Surface convergence pattern measured at the time of first
formation of cumulus clouds:Slide10
The mature stage:
Rain first reaches the ground; heaviest rain and strongest turbulence in this stage
Downdraft forms from above the FL
Updrafts also remain strong, most intense higher in cell
Strong surface divergence forms below the heaviest rain, and the cloud outflow forms a gust front at the surface
Both positive and negative buoyancy is present (
q
v
’~ 2
K)
Wind, temperature, and hydrometeorsSlide11
Surface wind measurements show outflow below the region of radar echo
echo
>30 dB
New convergence line ??Slide12
The dissipating stage:
LL divergence
Downdrafts weaken, turbulence becomes less intense, and precipitation decreases to light rain.
Lasts about 30 min
Wind, temperature, and hydrometeorsSlide13
the Thunderstorm Project
The 3 storm stages have since been interpreted as characteristic of airmass thunderstormsByers and Braham recognize the importance of wind shear: “strong shear prolongs the mature stage by separating the precipitating region with downdrafts from the updraft region”
They also estimate entrainment: estimated from mass balance: 100% in 2 kmestimated from soundings around storms: 100% in 5 kmdiscrepancy probably arose from downward motion of mixtures after entrainment, making the former estimate more reliableSlide14
8.2 Airmass Thunderstorms
Scattered, small, short-lived, 3 stages
Environment has little CAPE, but also little CIN, and little wind shear
They are usually triggered along shallow convergence zones (BL forcing)
Rarely produce extreme winds and/or hail, but may be vigorous with intense lightningSlide15Slide16
Photo by NSSLSlide17
Mature airmass thunderstorms over the Pacific seen by the Space ShuttleSlide18
height
(100s of
ft
)
Schematic of the evolution of an airmass storm, as seen by radar
The reason why an airmass thunderstorms is so shortlived is that there is little wind shear, therefore the rainy downdraft quickly undercuts and chokes off the updraft.
Photo by MollerSlide19
airmass thunderstorm evolution
Fig. 7.7Slide20
8.3 Multicell Thunderstorms
Multicell
storms can occur in a cluster, or be organized as one line.
Individual
cells
are short-lived like any air-mass thunderstorm, but the
multicell
cluster
is long-lived, due to the ability of old cells to trigger new cells.The key to the long life of the multicell is the
interaction of the gust front with the ambient LL shear
gust front
shelf cloud above gust front
U
envSlide21
Multicell storms were recognized by Byers and
Braham (the Thunderstorm Project, 1948-49)
Byers and Braham recognized the importance of cold pool building by decaying cells in the triggering of new cells.Slide22
Multicell Thunderstorms
Shelf Cloud often indicates rising air over the gust front.New cells develop in front of the storm.Gust front maintained by the cool downdrafts.Gust front is typically several miles in front of the thunderstormGust front appears like a mesoscale cold front.
Outflow boundary is the remnant of a gust front.Slide23
The sequence on the right shows individual cells and their place in the evolution of a multicellular system.
Ludlam
Fig. 8.10
Role
of cell lifecycle in
multicell
stormsSlide24
young
cell
old
cell
Photo by
Doswell
Photo by Moller
Hobbs and
Rangno
1985
(small
multicell
Cb
over Cascades)Slide25
Multicell echo sequence
(Leary and Houze 1983)Slide26
single-cell vs multicell storms: effect of LL shear
balance between baroclinic & ambient horizontal vorticity leads to deeper ascent – more likley above the LFC (Rotunno, Klemp, Wilhelmson 1987, known as the RKW theory)
shear
no shearSlide27
5 km updraft (color)
-1K
q
’ (contour)
w
h
,
solenoidal
w
h, ambient 0-1 kmmulticell simulationsSlide28
multicell
simulations: cluster migration towards region with higher CAPESlide29
8.4 Supercell Thunderstorms
Fig. 8.16
Supercell
thunderstorms are defined as having a sustained deep-tropospheric updraft ~coincident with a mid-level vorticity maximum
They are typically ‘severe’ (strong horizontal wind gusts, large hail, flash flood, and/or tornadoes)
They are rare (<1% in US, <5% in Southern Plains in May), long-lived
They are easily identifiable on radar
Mesocyclone
(sometimes TVS)elongated anvil (to the east), often with a V notch
a hook-shaped flanking line (@ south side for right movers)bounded weak-echo region (BWER)reflectivity often suggests hail presenceThey form under strong shearsee right: composite hodographbased on 413 soundingsnear cyclonic supercells
Fig. 8.15
storm motionSlide30
Supercell Thunderstorms
occur most frequently in the southern Great Plains in spring.compared to single cells, supercells are:longer-livedlargerorganized with separate up- and downdrafts.Slide31
Mesocyclone & hook echo
storm motion to the ENE (70°)
radar to the south
3 May 1999 Moore OK F5 tornado:
reflectivity animation
radial velocity animation
Fig. 8.18Slide32
anvil
mesocyclone
photo Josh Wurman
cyclonic supercell storm: visual aspectsSlide33
LP
photo credit:
NguyenSlide34
Photo by Bill McCaul
low-precipitation supercellsSlide35
LP supercellSlide36
photo credit:
Nguyen
HPSlide37
Fig. 8.15
storm motion
storm-relative flow in a supercell
composite hodo from ~400 soundings near supercell storms
Fig. 8.20
young
supercell
mature
supercell
Fig. 8.23:
sfc
pressure perturbations (contours –
mb
), -1K cold pool, rain water @ 1 km (green colors), and updraft @ 1 km (pink)
interpret this inflow low
using
Bernouilli
eqn
0.5r
v
2
+p’=constantSlide38
the bounded weak echo region (BWER)
Fig. 8.21 in textbook
RHI
Fig. 8.22Slide39
How does the BWER form ?
As the storm intensifies, the updraft becomes stronger and more erect.
The result are:
the development of mid-level echo overhang (WER)
a tighter reflectivity gradient (hail is most common just north of the WER)
a shift in cloud top position (right above the WER)
These are strong indicators of a dangerously severe storm.Slide40
Base scan (0.5°) RHI
16.5 km echo tops
NW
SE
BWER on radar: range height indicator (RHI) displays
(source: WSR-88D Operations Training Manual)Slide41
south to north
west to east
BWER using horizontal & vertical slices
(e.g., in soloii)
Fig. 8.19Slide42
fallspeed of hail
as function of
diameter D
BWER & the hail cascadeSlide43
Where do we go from here?
covered in 2011: Section 8.4 Supercell dynamics: COMET/METED
Supercell rotation8.4.3: origin of mid-level rotation 8.4.4: solenoidal vorticity and the mesocyclone 8.4.5
: storm splitting &
supercell
propagation
homework #3: Weisman: convective storm matrix: buoyancy-shear dependencies. COMET-
MetEd module not covered in 2011:
9. Mesoscale organization:Mesoscale Convective Systems: Squall Lines and Bow Echoes (webcast)MCSs: BAMEX Science OverviewMCV dynamics (Fritsch 1996)
not covered in 2011: 10. Severe weather hazards:severe weather & storm environmenttornado dynamicsderechoes: straight line windsSlide44
Storm classification summary
variables:
buoyancy and shear profiles