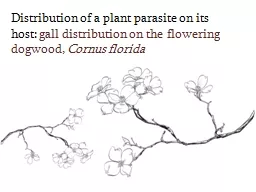
/
Distribution of a plant parasite on its host: Distribution of a plant parasite on its host:

Distribution of a plant parasite on its host: - PowerPoint Presentation

tawny-fly
tawny-fly . @tawny-fly
Follow
411 views
Uploaded On 2016-04-25

Distribution of a plant parasite on its host: - PPT Presentation

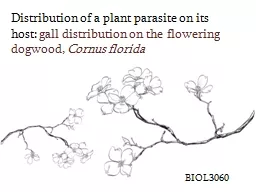
gall distribution on the flowering dogwood Cornus florida BIOL3060 Overview A Parasite Gall Midge Fly Resseliella clavula B Host Flowering dogwood Cornus floria ID: 292577

galls distribution dogwood trees distribution galls trees dogwood midge gall task freedom larvae degrees affect parasites midges clumped related

Share:

Link:

Embed:

Download Presentation from below link

Download Presentation The PPT/PDF document "Distribution of a plant parasite on its ..." is the property of its rightful owner. Permission is granted to download and print the materials on this web site for personal, non-commercial use only, and to display it on your personal computer provided you do not modify the materials and that you retain all copyright notices contained in the materials. By downloading content from our website, you accept the terms of this agreement.


Presentation Transcript

Slide1

Distribution of a plant parasite on its host: gall distribution on the flowering dogwood, Cornus florida

BIOL3060Slide2

Overview(A) Parasite: Gall Midge Fly (Resseliella clavula

)(B) Host:

Flowering dogwood (Cornus floria)

Process

Female fly lays eggs near terminal dogwood bud (late spring).

Eggs hatch & larvae enter dogwood shoots.Abnormal swelling (galls) form on twig ends (summer).Larvae exit galls and overwinter in soil. Pupate in early spring. Become adults in late spring.Larvae get protection and food source.Plants expend more energy regenerating tissue.Slide3

PurposeTo determine the distribution of midge galls on dogwood trees and to investigate some environmental factors that might influence distribution.

Questions

1) How are the galls distributed spatially?Random vs. clumped vs. uniform

2) Could gall distribution be related to:

Size/age of the plant? Nearest neighbor distance? Sunny versus shady microhabitat?Slide4

Question 2. Could gall distribution be related to:

Tree sizeO

lder and infirm trees might be more likely to be attacked by the midge parasite. How could this affect distribution?

Distance to nearest neighbor

If trees are close together, they might be more likely to “catch” galls

. How could this affect distribution?Collect data in two habitatsWarmer environments might be better for midges. Environments with more vigorous trees might affect midge choices. How could this affect distribution?Slide5

Clumped DistributionMost trees have few parasites, and some a lot.Typically associated with:disease outbreakstree densities (“contagious”)age-related effects

0

30

30

30

30

0

0

0

0

0

0

0

0

0

0

0

0

0

0

30Slide6

Even Distribution“Regular”: Organisms are evenly spaced in the environment. In our case, every tree would have the same number of galls. This would suggest that the parasites are competing for the trees.

10

10

10

10

101010

10

10

10

10

10

10

10

10Slide7

Random DistributionParasites are randomly distributed within the environment. If midges flew until they “hit” a dogwood haphazardly …

40

20

20

30

302020

20

10

20

30

40

30

20

20

30

30

30

20

20

40

40Slide8

Hypotheses and predictionsH1 Midge galls are like a disease for dogwoods, some are attacked while others are not. prediction: the distribution of galls on dogwoods is clumped. H2 Gall midges compete for laying sites, and larvae cannot survive if they are too close to each other.

 prediction: the distribution of galls on dogwoods is regular (even).

 Slide9

Task 1. Student’s T-test1) # galls2) dbh3) dnnAlso use the excel function TTEST

Degrees of Freedom:Df = (n1-1) + (n2

-1)

P=0.05 Slide10

Probability Levels for Student’s t-Distribution (Two-sided Probability Level)

Degrees

of Freedom

Sample Size

Value of

p

0.5

0.2

0.1

0.05

0.01

3

5

0.77

1.64

2.35

3.18

5.84

5

7

0.73

1.48

2.02

2.57

3.36

10

12

0.70

1.37

1.81

2.23

3.17

15

17

0.69

1.34

1.75

2.13

2.95

30

32

0.68

1.31

1.70

2.04

2.75

38

40

0.68

1.30

1.69

2.03

2.71

40

42

0.68

1.30

1.68

2.02

2.70

50

52

0.68

1.30

1.68

2.01

2.68

100

102

0.68

1.29

1.66

1.98

2.63

1000

1002

0.67

1.28

1.65

1.96

2.53Slide11

Task 2. HistogramUse countif statements# galls/ tree

# trees in edge habitat

# trees in canopy habitat

0-2


3-5


6-8


9-11


12-14


15-17


18-20


21-23


24-26


27-29


30-32


33-35


36-38


39-41


 Slide12

Task 3. What is the distribution of galls in the forest?Index of Dispersion (Id)Slide13

Critical Values of the Chi-Square Distribution For p = 0.05 Degrees of Freedom Lower Upper10 3.94 18.31

15 7.26 25.00 18 9.39 28.90

19 10.10 30.14 20 10.85 31.41 25 14.61 37.65

30 18.49 43.77

35 22.47 49.80

40 26.51 55.76 45 30.61 61.66 50 even 34.76 rand 67.51 clump55 38.96 73.31 60 43.19 79.08 65 47.45 84.82 70 51.74 90.53 75 56.05 96.22 Slide14

Task 4. Correlations1) dbh vs. # galls2) dnn vs. # gallsDegrees of Freedom:Df= (n-2)P=0.05 Slide15

Task 5. Scatter plots (2)Slide16
Slide17

Before you leave today:Fill out chart on Pg 513 graphs (histogram, 2 correlation plots)Slide18

Before you leave today:Transfer your data to spreadsheet on TA’s computer.