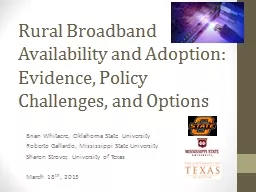
Brian Whitacre Oklahoma State University Roberto Gallardo Mississippi State University Sharon Strover University of Texas March 18 th 2013 Webinar Content Data utilized Nature and extent of the metro nonmetro broadband digital divide ID: 716360
Download Presentation The PPT/PDF document "Rural Broadband Availability and Adoptio..." is the property of its rightful owner. Permission is granted to download and print the materials on this web site for personal, non-commercial use only, and to display it on your personal computer provided you do not modify the materials and that you retain all copyright notices contained in the materials. By downloading content from our website, you accept the terms of this agreement.
Slide1
Rural Broadband Availability and Adoption: Evidence, Policy Challenges, and Options
Brian Whitacre, Oklahoma State UniversityRoberto Gallardo, Mississippi State UniversitySharon Strover, University of TexasMarch 18th, 2013Slide2
Webinar Content
Data utilizedNature and extent of the metro – non-metro broadband digital divideFactors that strengthen or impede broadband adoption in rural areasBroadband’s contribution to economic health in rural areasPolicy options & discussionSlide3
Definitions
Metro / Micro / Noncore CountiesMetropolitan: Urban core of ≥ 50,000 (or 25% of workforce commutes to an urban core)Micro: Urban core of 10,000 – 49,999 (or 25% of workforce commutes to an urban core of that size)Noncore: The restBroadbandCurrent: 4 mbps Down, 1 mbps Up
Historical: 200 kbps in at least 1 directionVarious thresholds used depending on data sources
NonmetroSlide4
Data Used
Current Population Survey – Internet use supplementYears: 2003, 2010 (most current)40,000+ observations (10,000+ non-metro); household-levelOnly differentiates between metro / non-metro (no county ID)FCC County-level broadband adoption dataYears: 2008,2010, and 2011 (most current)3,000+
counties671 micropolitan1,366 non-coreNational Broadband Map – Neighborhood levelYears: 2010, 20113,000+ countiesAggregated to county-level
We mesh adoption data with availability dataSlide5
Metro Vs. Non-MetroBroadband Divide
Household Broadband Adoption Rates by Metro/NM Status, 2003 and 2010Source: Current Population Survey Internet Use Supplement, 2003 & 2010
Metro – Non-metro Gap
consistent
since 2003Slide6
Metro Vs. Non-Metro
Broadband Divide
Household Broadband Adoption Rates by Income, 2003 and 2010
Source: Current Population Survey Internet Use Supplement, 2003 & 2010
Metro – Non-metro Gap higher in 2010 for lower income levelsSlide7
Metro Vs. Non-Metro
Broadband Divide
Household Broadband Adoption Rates by Education, 2003 and 2010
Source: Current Population Survey Internet Use Supplement, 2003 & 2010
Metro – Non-metro Gap higher in 2010 for lower education levelsSlide8
Metro Vs. Non-Metro
Broadband Divide
Household Broadband Adoption Rates by Age, 2003 and 2010
Source: Current Population Survey Internet Use Supplement, 2003 & 2010
Metro – Non-metro Gap higher in 2010 for those over age 60Slide9
Metro Vs. Non-Metro
Broadband Divide
Household Broadband Adoption Rates by Race, 2003 and 2010
Source: Current Population Survey Internet Use Supplement, 2003 & 2010
Metro – Non-metro Gap
higher
in 2010 for Blacks, Hispanics, Other raceSlide10
Metro Vs. Non-Metro
Broadband Divide
Primary Reason for Non-adoption of Broadband in NM Households, 2003 & 2010
Source: Current Population Survey Internet Use Supplement, 2003 & 2010Slide11
Metro Vs. Non-Metro
Broadband Divide
Composition of Residential Broadband Connections, 2003 & 2010
Source: Current Population Survey Internet Use Supplement, 2003 & 2010Slide12
Metro Vs. Non-Metro
Broadband Divide
County-level Broadband Adoption by Metro Status, 2008-2011
Source: FCC Form 477 Data
FCC Data: 5 Adoption categories
<20%
20-40%
40-60%
60-80%
>80% Slide13
Metro Vs. Non-MetroBroadband Divide
County-level Broadband Adoption Gaps, 2008 and 2011Source: FCC Form 477 Data
Metro – Micro , Metro – Non-core Gaps
shrinking
since 2008Slide14
Metro Vs. Non-Metro
Broadband Divide
County-level Household Broadband Adoption Rates, 2011
Source: FCC Form 477 Data
Pockets of low adoption exist…Slide15
Metro Vs. Non-Metro
Broadband Divide
County-level Household Broadband Adoption Rates and Number of Providers, 2011
Source: FCC Form 477 Data
…but relationship with number of providers not overwhelmingCorrelation Coefficients:
0.32 (all counties)
0.09 (non-core)Slide16
Metro Vs. Non-Metro
Broadband Divide
Percent of Population with No Broadband Availability, by Metro Status (2010)
Source: National Broadband Map Data (aggregated to County level)
Pockets with High Levels of “No Broadband”One additional measure: % of population with no broadband available to themSlide17
Metro Vs. Non-MetroBroadband Divide
No Broadband Availability, by Metropolitan Status (2010)Source: National Broadband Map Data (aggregated to County level)
Many noncore counties with SIGNIFICANT (>40%) portions of their population lacking access to broadbandSlide18
Metro Vs. Non-MetroBroadband Divide: Download Speed
Average Max. Advertised Download Speed by Metro Status, 2010 & 2011Source: National Broadband Map Data aggregated to County LevelSlide19
Metro Vs. Non-MetroBroadband Divide: Upload Speed
Average Max. Advertised Upload Speed by Metro Status, 2010 & 2011Source: National Broadband Map Data aggregated to County LevelSlide20
Factors Affecting BroadbandAdoption in Rural Areas
What Impacts Household Broadband Adoption? (CPS Data)
+ Impact: income, education, home business, Internet at work
- Impact: race / ethnic categories (Black, Hispanic), non-metro statusAvailability Measures Impacting Adoption
+ Impact: Hi Availability (<15% No BB)
- Impact: Low # Providers (<3)
No Statistical Impact
Low / Hi Download speeds
Low / Hi Upload speeds
Hi # of ProvidersSlide21
Factors Affecting BroadbandAdoption in Rural Areas
What is Driving the Metro – Nonmetro Gap?
Broadband AdoptionGap explainedDescription2003
47.3% (CD)52.7% (PD)Mainly due to characteristic differences (CD), specifically higher incomes/ educational levels in metro areas2010
54.3% (CD)45.7% (PD)Parameter differences (PD) became a tad less relevant2010 (Availability)89.9% (CD)
10.1% (PD)
Dramatic jump in explanatory
power of characteristics differences (CD) when incorporating availability measure
Takeaway: If NM households were given the same characteristics as Metro households, ~50% of the BB Gap disappears.
If they also had the same levels of BB availability, 90% disappears!
2003: 11% 24%
2010: 57% 70%
NM
MetroSlide22
Factors Affecting BroadbandAdoption in Rural Areas
What is driving the increased adoption over time?Focus only on non-metro areas
Broadband AdoptionGap explainedDescription
2003-20104.5% (CD)95.5% (PD)Increase in non-metro adoption rate was due to shifting parameters -- likelihood of adopting for any income/educational level increased over time
This is predicted by diffusion theory: as broadband becomes more common, all types of households are more likely to adopt
2003: 11%
2010: 57%
NMSlide23
Factors Affecting BroadbandAdoption in Rural Areas
What is Driving Broadband Adoption at the COUNTY Level? (FCC Data)
+ Impact: education, income, population, (though not in non-core counties); high concentrations of jobs in real estate / information
- Impact: share of non-farm proprietors, race / ethnic categories (only in non-core)
Availability Measures Impacting AdoptionHigh # Providers (>6)
Low # Providers (<3)
Low Download Speed (<3-6mbps)
2010
High Download Speed (>10 mbps)
Low Download Speed (<3-6mbps)
2011
Shift from
# Providers
to
Download SpeedSlide24
Factors Affecting BroadbandAdoption in Rural Areas
Explaining increasing county-level rates (2008 – 2011)
+ Impact:
higher population, higher
income, more residential BB providers-
Impact: higher unemployment rates
Significant % of counties increased their levels of BB adoptionSlide25
Factors Affecting BroadbandAdoption in Rural Areas
Connected Nation Case Study: Pre/post studyCounty-level data based on two (2) states that began after 2008 ; used Mahalanobis technique to match participating counties with otherwise similar non-participant counties
Participating counties did exhibit higher increases
in the number of residential providers (particularly in noncore)
However, only metro counties saw higher increases in broadband adoption…micro counties were negativeFCC Data (2008)
CN Participation (2008-09)
FCC Data (2011)
CN Non-participantsSlide26
Broadband’s Contribution to Economic Health in Rural Areas
Cross-section Spatial ModelsFirst-differenced RegressionPropensity Score Matching
3 Distinct Modeling Efforts
Listed in order of increasing claims that can be made about causality
Economic Health Variables of Interest
(Typically measured in 2010)
% of employees classified as “creative class”
% of non-farm proprietors (self-employed)
Non-farm proprietor income
Median household income
% in poverty
Number of firms with paid employees
Total employed
Adoption / Availability Measures to Test
(Measured in 2010)
Low % without BB Availability (<15%)
Hi download speeds (> 10 mbps)
Hi adoption rates (>60%)
Hi # providers (≥6)
High % without BB Availability (>35%)
Low download speeds (<3 mbps)
Low adoption rates (<40%)
Low # providers (≤3)Slide27
Broadband’s Contribution to Economic Health in Rural Areas
Cross-section spatial models: 2010 Economic health indicatorsPopulation size, educational attainment, age groups, race/ethnicity, unemployment rate, metro status, and natural amenities were used as control variables; the broadband adoption/availability
measures were our primary variables of interestPercentage of population without broadband and low number of providers impacted all (7) economic health indicatorsIncreases in the percent population without access to broadband were associated with decreases in nonfarm proprietor average income, median household income, total firms with paid employees, and total employedAll “high”
broadband adoption/availability had a positive impact on total jobs and number of firms while all “low” indicators had a negative impactSlide28
Broadband’s Contribution to Economic Health in Rural Areas
First differenced regressions: Dependent Variable: 2008-2010 Change in Economic Health indicators
Increases in broadband adoption had a positive impact on changes in median household income and total employment (analysis limited to non-metro counties)
Particularly impressive – focuses on only recent adoption and over a short period of time
No impacts on economic health indicators when using change in residential providers rather than broadband adoptionSlide29
Broadband’s Contribution to Economic Health in Rural Areas
Propensity score matching: economic health indicatorsCompared treated (using broadband availability/adoption criteria) versus non-treated counties; matched based on their probabilities of reaching the broadband threshold
High levels of Broadband adoption (in non-metro counties) influenced economic growth increasing median household income and reducing poverty, unemployment
Low levels of Broadband adoption negatively impacted changes in number of firms, total employment, and unemployment rates
Broadband adoption thresholds impact economic health more than availabilitySlide30
In summary …Some gains, but lags remain
Using CPS household-level data, the broadband adoption gap between metro and non-metro areas remained at 13 percentage points in both 2003 and 2010; however this gap increased among low income, low education, and elderlyUsing FCC county-level data, rural counties experienced a
significant improvement regarding broadband adoption between 2008 and 2011Logistic regressions showed traditional factors – income, education, age, race, and non-metro location – playing a role in adopting broadband between 2003 and 2010; low numbers of providers have a negative impact while higher levels of broadband availability have a positive impactSlide31
In summary …quality of service and employment effects
Regression models: **employment in specific industries (real estate and information sectors) as well as broadband speed have an impact on adoption ratesConnected Nation case studies:
**positive results increasing the number of providers in rural counties, but no increase in broadband adoption We found that low levels of adoption, providers, and broadband availability associated with lower median household income, higher levels of poverty, and decreased numbers of firms and total employmentSlide32
In summary …economic impact
Statistical analysis showed that increases in broadband adoption between 2008 and 2010 resulted in higher levels of median household income and total employment (for non-metro counties)Model results found that broadband
adoption thresholds have more impact on changes in economic health indicators than broadband availability thresholds in non-metro counties between 2001 and 2010Slide33
Policy Options
Draw broadband infrastructure to less economically robust regions lacking broadband (FCC’s Connect America Fund, FCC Broadband Adoption Pilot Program incentives)However, availability is not the entire solutionHigher number of providers does not translate into increases in adoption, particularly in non-metro areas (Connected Nation case study)The demand side – broadband adoption – must receive attention as wellFocus adoption programs on populations with lower levels of income and education as well as racial/ethnic minorities, also rural regionsSlide34
Policy Options
Place-based differences have become less important over time (decomposition results)Limited exposure can depress peoples’ interest in broadbandPolicy implication: community anchor sites, highly public demonstrations of broadband’s potentialBuild on diffusion factors such as trialability, observability, compatibility to expose non-adopters to the technologyThough wireless deployment is helpful, many of the productivity gains and economic advantages of broadband are limited through this technology
Support data gathering related to price / affordability (including bundles) and service quality (speed)Slide35
Some Light Reading…