PPT-TABLEAU DE SUIVI DES INDICATEURS DE PERFORMANCE (IPTT)
Author : tawny-fly | Published Date : 2019-11-07
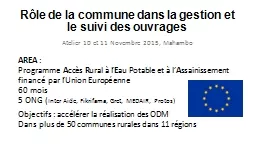
TABLEAU DE SUIVI DES INDICATEURS DE PERFORMANCE IPTT Formation sur le suiviévaluation des projets de sécurité alimentaire relevant du Bureau de lalimentation
Presentation Embed Code
Download Presentation
Download Presentation The PPT/PDF document "TABLEAU DE SUIVI DES INDICATEURS DE PERF..." is the property of its rightful owner. Permission is granted to download and print the materials on this website for personal, non-commercial use only, and to display it on your personal computer provided you do not modify the materials and that you retain all copyright notices contained in the materials. By downloading content from our website, you accept the terms of this agreement.
TABLEAU DE SUIVI DES INDICATEURS DE PERFORMANCE (IPTT): Transcript
Download Rules Of Document
"TABLEAU DE SUIVI DES INDICATEURS DE PERFORMANCE (IPTT)"The content belongs to its owner. You may download and print it for personal use, without modification, and keep all copyright notices. By downloading, you agree to these terms.
Related Documents