/
Using AIS to inform Marine Spatial Planning Using AIS to inform Marine Spatial Planning

Using AIS to inform Marine Spatial Planning - PowerPoint Presentation

tawny-fly
tawny-fly . @tawny-fly
Follow
393 views
Uploaded On 2016-10-29

Using AIS to inform Marine Spatial Planning - PPT Presentation

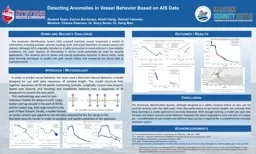
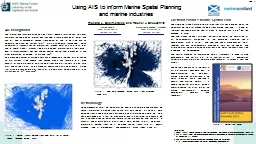
and marine industries Richard L Shelmerdine and Rachel J Shucksmith AIS background The International Maritime Organisation IMO require all marine vessels over 300 gross tonnage on an international voyage all cargo vessels greater than 500 ID: 482156

vessels vessel shetland marine vessel vessels marine shetland information fig ais figure oil data density smsp cargo recorded fishing

Share:

Link:

Embed:

Download Presentation from below link

Download Presentation The PPT/PDF document "Using AIS to inform Marine Spatial Plann..." is the property of its rightful owner. Permission is granted to download and print the materials on this web site for personal, non-commercial use only, and to display it on your personal computer provided you do not modify the materials and that you retain all copyright notices contained in the materials. By downloading content from our website, you accept the terms of this agreement.


Presentation Transcript

Slide1

Using AIS to inform Marine Spatial Planningand marine industries

Richard L. Shelmerdine and Rachel J. Shucksmith

AIS background

The International

Maritime Organisation (IMO)

require

all marine vessels over 300 gross tonnage on an international voyage, all cargo vessels greater than 500 gt, and all passenger vessels irrespective of size to be fitted with an Automatic Identification System (AIS)1. AIS is a shipboard transponder which automatically transmits vessel information, through VHF, as a ship to ship or ship to shore signal. Transmitted data includes information on the vessel identity (mmsi number), position, speed, course, vessel type, dimensions, and other information as outlined by Ou and Zhu2.An increasing number of marine users have recognized the benefits of having an AIS system fitted aboard their vessels which has resulted in a large quantity of available vessel data ranging from large oil tankers to pleasure craft and sailing ships. The European Commission has additionally stated that all fishing vessels greater than 15 m in length must be equipped with an AIS system by 31st May 20143.

Marine ScientistNAFC Marine Centre,Shetland, ZE1 0UNrichard.shelmerdine@uhi.ac.uk

Marine Spatial Planning ManagerNAFC Marine Centre,Shetland, ZE1 0UNrachel.shucksmith@uhi.ac.uk

Slide 1

MethodologySince December 2012, the NAFC Marine Centre has collated and processed vessel information, obtained from vessel AIS data feeds. All signals were obtained from a single antenna positioned in central mainland Shetland. Data was downloaded as a text file, processed, quality controlled, and combined with a bespoke vessel database before further processing and analysis in ArcGIS. The primary output in GIS was a point dataset (Fig 1). Additional information, derived from Fig 1, included vessel tracks (Fig 2), density mapping (Slide 2), interpolations, and connectivity maps (Slides 2 and 3).

Shetland Island’s Marine Spatial Plan

The Shetland Island’s Marine Spatial Plan (SMSP) was developed by the NAFC Marine Centre through funding from Marine Scotland. It is one of the most advanced Marine Spatial Plans in Europe with the 4th edition launched in 2014.Shetland Islands Council will adopt the fourth edition of the SMSP (Fig 3) as ‘Supplementary Guidance’ to the emerging Shetland Local Development Plan in 2014. The Shetland Local Development Plan, together with any Supplementary Guidance, sets out the policies and criteria against which planning applications and works licenses submitted in Shetland will be considered.The SMSP provides an overarching policy framework to guide marine development and activity out to 12 nautical miles. It incorporates authoritative spatial data on the marine environment, its various uses, and assets.

Figure 1. Point data received during 2013 from all vessels using AIS.

Figure 2. Vessel tracks, derived from point data, for all vessel signals received during 2013.

References

1 Anon. (2012); SOLAS Chapter V Safety of Navigation. International Maritime Organisation (IMO). p. 29.2 Ou Z, Zhu J. (2008); AIS database powered by GIS technology for maritime safety and security. Journal of Navigation 61: 655-65.3 The EU system for fisheries controls. Accessed on 5th July 2014 from: http://ec.europa.eu/fisheries/cfp/control/technologies/index_en.htm

The policies and maps in the SMSP will be material considerations in decision-making on individual marine planning applications and works licenses within Shetland’s coastal and marine waters. It is hoped the SMSP will also provide a useful resource for all users of the marine environment including developers, planners and regulators.

Figure 3.

SMSP front coverSlide2

Slide 2

Fisheries

High densities of fishing vessels display the fishing grounds, common routes to the grounds, and entry to the main harbours of

Lerwick

and

Scalloway

. Traditionally VMS has been used to map fishing grounds but AIS provides a higher resolution output, includes international vessels, has no ownership restrictions, and provides information on vessel transit routes.CargoLerwick, on Shetland’s east coast, had the highest density of cargo traffic entering the harbour from the south entrance. A high density of traffic was also noted around Scalloway, Shetland’s west coast. Distinct cargo routes were identified passing the Islands to the northeast, southwest, and west.PassengerThis category includes both ferries and seasonal cruise liners. The high densities are mostly related to inter-island ferries showing their most frequent path but also the outer limits for each route. This information was used to refine ferry routes within the SMSP.Oil related vesselsA high density of traffic was recorded through the north entrance to

Lerwick harbour as well as Scalloway in the west. Vessels using Lerwick were found to access oil fields, displayed as high offshore densities, on both sides of Shetland.Oil/chemical tankers

The highest tanker densities were located at Sullom Voe and the approach to Sullom in the north, Lerwick harbour, and a known anchorage to the south of Lerwick

harbour. Much of the traffic remained outside the 12 nm limit although a clear transit route was visible between Fair Isle and the southern tip of Shetland mainland.

Density by vessel typeFigure 5. Density maps derived from vessel track information.Figure 4. Vessel track information.

Figure

6. Vessel type for all vessels found within 12 nm of Shetland.Vessel types, tracks, and densitiesWhen examined by vessel type entering the 12 nm limit during 2013 (Fig 6), 29% were related to the oil industry (both oil related vessels and tankers), followed by fishing (27%), cargo (20%), and pleasure (12%). Vessel tracks (Fig 4) were derived from point data enabling density maps (Fig 5) to be created for all traffic and for each vessel category type.

National scaleFigure 7. The offshore supply ship

Fugro Symphony leaving Scalloway harbour.Slide3

Slide 3

Vessel origins and destinations

Vessels entering the 12 nm limit around Shetland, over one year, originated from 152 ports in 26 different countries around the World (Fig

7).

Countries were mostly centred around the North Sea but did span as far as United Arab Emirates and Puerto Rico. Of the 1212 different vessels recorded within 12 nm of Shetland, 231 usable destinations were recorded in 23 different countries around the World (Fig

8).

The majority of destinations were located within Great Britain but were also spread as far as Panama and Guyana in South America, and Nigeria and Côte d’Ivoire in west Africa.International scaleFigure 8. Destinations of vessels leaving the 12 nm limit around Shetland.Figure 7. Last country visited before entering the 12 nm limit around Shetland.

Last country visitedFisheriesThe majority of fishing vessels’ last port was from UK. Last countries visited included Norway (n=52), Denmark (n=24), Ireland (n=14), and Iceland (n=2).Cargo

The majority of cargo vessels originated from Europe with the greatest number originating from Germany (n=133 vessels) and Denmark (n=120). Countries as far afield as UAE, north Africa, and USA were also connected.PassengerWith the exception of one vessel originating from Puerto Rico and six from Faroe, the last country visited by passenger vessels were located around the North Sea with seven vessels having a recorded last port in Norway.

Oil related vessels

Vessels coming within 1 nm of Shetland had a recorded last country visited of Norway (n=68), Netherlands (n=50), Faroe (n=6), and USA (n=2). Panama was recorded 41 times for vessels coming within 6 nm.Oil/chemical tankersOutside UK, Netherlands had the most recorded last port calls of 188 followed by Germany (n=53) and Poland (n=38). Most visits originated around mainland Europe but also Faroe (n=4), Iceland (n=2), North Antilles (n=3), and USA (n=9).

Risk mappingAs part of the biosecurity plan for Shetland, risk modelling was carried out to identify areas of relative risk of the introduction of invasive non-native species (INNS). Modelling was based on potential vectors (hull

biofouling and ballast water exchange) and stepping stones (e.g. marine renewables, aquaculture sites, shore access points), allowing targeted monitoring for INNS. Vessel information, through AIS,

was

essential for providing vector information by identifying where shipping was coming from (Fig 7), going to (Fig 8

), and combined with vessel type information (Slide 2). The combined output was then mapped for Shetland as a relative risk map (Fig 9).

Figure 9. Relative risk map.