PDF-Crisis squeezes income and puts pressure on inequality and poverty
Author : test | Published Date : 2015-10-31
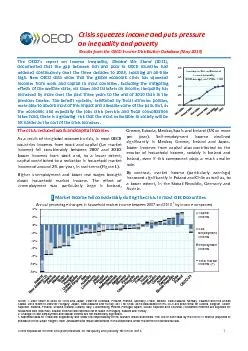
1 Crisis squeezes income and puts pressure on inequality and poverty Results from the OECD Income Distribution Database May 2013 The OECDx2019s report on income
Presentation Embed Code
Download Presentation
Download Presentation The PPT/PDF document "Crisis squeezes income and puts pressure..." is the property of its rightful owner. Permission is granted to download and print the materials on this website for personal, non-commercial use only, and to display it on your personal computer provided you do not modify the materials and that you retain all copyright notices contained in the materials. By downloading content from our website, you accept the terms of this agreement.
Crisis squeezes income and puts pressure on inequality and poverty : Transcript
Download Rules Of Document
"Crisis squeezes income and puts pressure on inequality and poverty "The content belongs to its owner. You may download and print it for personal use, without modification, and keep all copyright notices. By downloading, you agree to these terms.
Related Documents