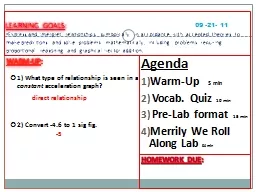
/
Warm-up What should you do if you see a fire in the lab? Warm-up What should you do if you see a fire in the lab?

Warm-up What should you do if you see a fire in the lab? - PowerPoint Presentation

thousandnike
thousandnike . @thousandnike
Follow
342 views
Uploaded On 2020-06-16

Warm-up What should you do if you see a fire in the lab? - PPT Presentation

Unit 1a The scientific method Or never say I have a theory The scientific method Pattern of logical investigation involving stating a problem forming a hypothesis researching and gathering information testing a hypothesis analyzing data drawing conclusions ID: 779563

axis data bar room data axis room bar graphs variable hypothesis thermostat scientific experiment line histograms temperature dependent theory

Share:

Link:

Embed:

Download Presentation from below link

Download The PPT/PDF document "Warm-up What should you do if you see a ..." is the property of its rightful owner. Permission is granted to download and print the materials on this web site for personal, non-commercial use only, and to display it on your personal computer provided you do not modify the materials and that you retain all copyright notices contained in the materials. By downloading content from our website, you accept the terms of this agreement.


Presentation Transcript

Slide1

Warm-up

What should you do if you see a fire in the lab?

Slide2

Unit 1a: The scientific method

Or, never say, “I have a theory!”

Slide3

The scientific method

Pattern of

logical

investigation

involving stating a problem, forming a

hypothesis

, researching and gathering information, testing a hypothesis, analyzing data, drawing conclusions.

A way of

thinking

Not restricted to

science

Can’t use the scientific method for

everything

Slide4

hypothesis

A

testable

, possible

explanation

for a problem using what is known and what is observed.

An untestable hypothesis = a

BAD hypothesisExample: “I think this electronic box on the wall controls the room temperature”

Slide5

Good or Bad hypothesis?

Love is the most important thing in the universe.

Love is claimed by most people to be the most important thing in the universe.

Chocolate is the best tasting substance in the world.

People exposed to chocolate in their culture are more likely to enjoy it.

Bananas outperform Gatorade as a recovery food/drink after a marathon.

Before the universe existed, there was a giant walrus whose consciousness was the only thing that existed.

Slide6

experiment

Organized procedure for

testing

a hypothesis; tests the effect of one thing on another under

controlled

conditions

Slide7

variable

Quantity

that can have more one value. Can

change

in an experiment.

Examples: thermostat settings, room temperature, humidity, etc.

OFF

65°

85°

Slide8

Dependent variable

Factor that

changes

as a result of changes in

other

variables

Example: the temperature of the room

72°

Slide9

Independent variable

Factor that, as it changes,

affects

the measure of

another variable

Usually what

you manipulate

Example: thermostat setting

Slide10

Graphing variables

Use “DRY MIX” to remember

D

:

Dependent

M

: Manipulated

R

: Responds

I

:

Independent

Y

: Y-axis

X

: X-axis

Set temperature

Actual temperature

Slide11

constant

In an experiment, the variable that

does not change

Example: humidity,

size of room

. Size of AC unit.

Room 2

Room 1

Slide12

control

Standard

used for

comparison

of test results in an experiment.

Example: room with no thermostat.

Room 2

Room 1

Slide13

bias

Occurs when a scientist’s

expectations

change how the results of an experiment are

measured

or

viewed

.Example: scientist subconsciously ignores or exaggerates data

Slide14

model

Used to

represent

an idea object, or event that is too big, too small, too complex, or too dangerous to observe or test directly.

Example: a circuit

diagram

of the thermostat or a computer

simulation of a thermostat controlling the temp.

Slide15

Scientific theory

Explanation

of things or events based on knowledge gained from

many

observations, investigations, and experiments.

A theory is NOT a hunch!!!

Explains

the how

or the

why

.

Slide16

Scientific law

Statement about

what

happens in nature that seems to be

always

true

under certain conditions; does not explain why or how

something happens.

Examples: the law of gravity versus the theory of gravity.

Slide17

Theories

DO NOT

become laws!

Laws

are not

“better” than theories

Slide18

GRAPHICAL REPRESENTATION OF DATA

How to make your data speak, and how to read it

Slide19

Cartesian plots

Remember “DRY MIX”:

X-axis:

maniupulated

, independent

Y-axis: responding, dependent, what is measured

Slide20

Line graphs

Data points are connected by lines

Used for

many

data points of

continuous

data (often time) on the x-axis

Slide21

Line graphs

Slide22

Bar graphs

data point magnitude on

y-axis

represented as

vertical bar

/line

Used for plotting

non-continuous data, or continuous data with

few

data points, on x-axis, such as ice cream flavors, brands of shoes, color of light, seasons of year

Sometimes a bar graph or a line graph could be used to represent the same data

Slide23

Bar graphs

Slide24

Bar graphs

Slide25

histograms

special line/bar graphs where y-axis represents the

frequency

of a measure (

how common something is

)

Frequency can be represented as number, fraction, percentage, proportion

Usually dependent variable values are put on the y-axis, but here the

frequency

of values (or a range of values) is placed on the y-axis. [“DRY MIX “does NOT apply]

Typically there is no space between the bars

Examples: IQ chart, height of people in population, grades on an exam, lifespan, “bell curve”

Slide26

histograms

Slide27

histograms

Slide28

histograms