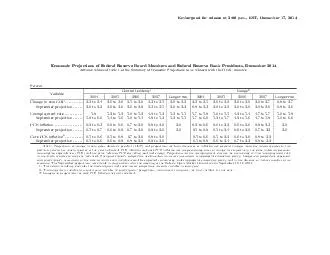
/
Advance release of table  of the Summary of Economic Projections to be released with the Advance release of table  of the Summary of Economic Projections to be released with the

Advance release of table of the Summary of Economic Projections to be released with the - PDF document

trish-goza
trish-goza . @trish-goza
Follow
517 views
Uploaded On 2014-12-13

Advance release of table of the Summary of Economic Projections to be released with the - PPT Presentation

20 to 22 26 to 30 26 to 29 23 to 25 20 to 23 18 to 23 21 to 32 21 to 30 20 to 26 18 to 26 June projection 21 to 23 30 to 32 25 to 30 na 21 to 23 19 to 24 22 to 36 22 to 32 na 18 to 25 Unemployment rate 59 to 60 54 to 56 51 to 54 49 to 53 52 to 55 5 ID: 23285

2014 projections longer run projections 2014 run longer rate pce 2016 2015 federal year june range ation 64258 policy

Share:

Link:

Embed:

Download Presentation from below link

Download Pdf The PPT/PDF document "Advance release of table of the Summary..." is the property of its rightful owner. Permission is granted to download and print the materials on this web site for personal, non-commercial use only, and to display it on your personal computer provided you do not modify the materials and that you retain all copyright notices contained in the materials. By downloading content from our website, you accept the terms of this agreement.


Presentation Transcript

Advancereleaseoftable1oftheSummaryofEconomicProjectionstobereleasedwiththeFOMCminutesPercent VariableCentraltendencyRange 2014201520162017Longerrun2014201520162017Longerrun ChangeinrealGDP.....2.0to2.22.6to3.02.6to2.92.3to2.52.0to2.31.8to2.32.1to3.22.1to3.02.0to2.61.8to2.6 Note:Projectionsofchangeinrealgrossdomesticproduct(GDP)andprojectionsforbothmeasuresofin\rationarefromthefourthquarterofthepreviousyearto EconomicProjectionsofFederalReserveBoardMembersandFederalReserveBankPresidents,September2014mbargoedforreleaseat2:00p.m.,EDT,September17,2014 Figure1.Centraltendenciesandrangesofeconomicprojections,2014{17andoverthelongerrun Percent 01234-+ 200920102011201220132014201520162017Longer Central tendency of projectionsRange of projectionsActual Unemployment ratePercent 56710 200920102011201220132014201520162017Longer Percent 123 200920102011201220132014201520162017Longer Note:De\fnitionsofvariablesareinthegeneralnotetotheprojectionstable.Thedatafortheactualvaluesofthevariablesareannual. Figure2.OverviewofFOMCparticipants'assessmentsofappropriatemonetarypolicy 1142 Appropriate timing of policy firmingNumber of participants 12345678910121415 201420152016 PercentAppropriate pace of policy firming: Midpoint of target range or target level for the federal funds rate 00.511.522.533.544.55 2014201520162017Longer run Note:Intheupperpanel,theheightofeachbardenotesthenumberofFOMCparticipantswhojudgethat,underappropriatemonetarypolicy,the\frstincreaseinthetargetrangeforthefederalfundsratefromitscurrentrangeof0topercentwilloccurinthespeci\fedcalendaryear.InJune2014,thenumbersofFOMCparticipantswhojudgedthatthe\frstincreaseinthetargetfederalfundsratewouldoccurin2014,2015,and2016were,respectively,1,12,and3.Inthelowerpanel,eachshadedcircleindicatesthevalue(roundedtothenearestpercentagepoint)ofanindividualparticipant'sjudgmentofthemidpointoftheappropriatetargetrangeforthefederalfundsrateortheappropriatetargetlevelforthefederalfundsrateattheendofthespeci\fedcalendaryearoroverthelongerrun. The charts show actual values and projections for three economic variables, fourth quarter of the previous year to the fourth quarter of the year Unemployment Rate—the average civilian unemployment rate in the fourth quarter of each year, with values plotted at the end of each year. expenditures (PCE) price index from the fourth quarter of the previous year to the fourth quarter of the year indicated, with values plotted at the Information for these variables is shown for each year from 2009 to 2017, and The solid line, labeled “Actual,” shows the historical values for each variable. The lightly shaded areas represent the ranges of the projections of ch variable is the lowest of all of the projections for that year or period. Likewise, the top of the range is the highest of all of the projections for that year or period. The dark shaded areas represent the central tendency, which is a narrower projections for each variable in each year or period. The longer-run projections, which are shown on the far right side of the charts, expects the economy to converge over time—maybe in five or six years—in projections for economic growth and s normal unemployment rate over the with the Federal Reserve’s dual mandate. which, by definition, is the future path and inflation that best satisfy his or her In the upper panel, the shaded bars represent the number of FOMC participants who judge that the initial increase in the target range for the federal In the lower panel, each dot in the chart represents the value (rounded to the percentage point) of an individual policymaker’s judgment of the appropriate target level for the federal funds rate at the end of the specified calendar year or over the longer run. These assessments of the timing of the initcompatible with their individual economic projections.