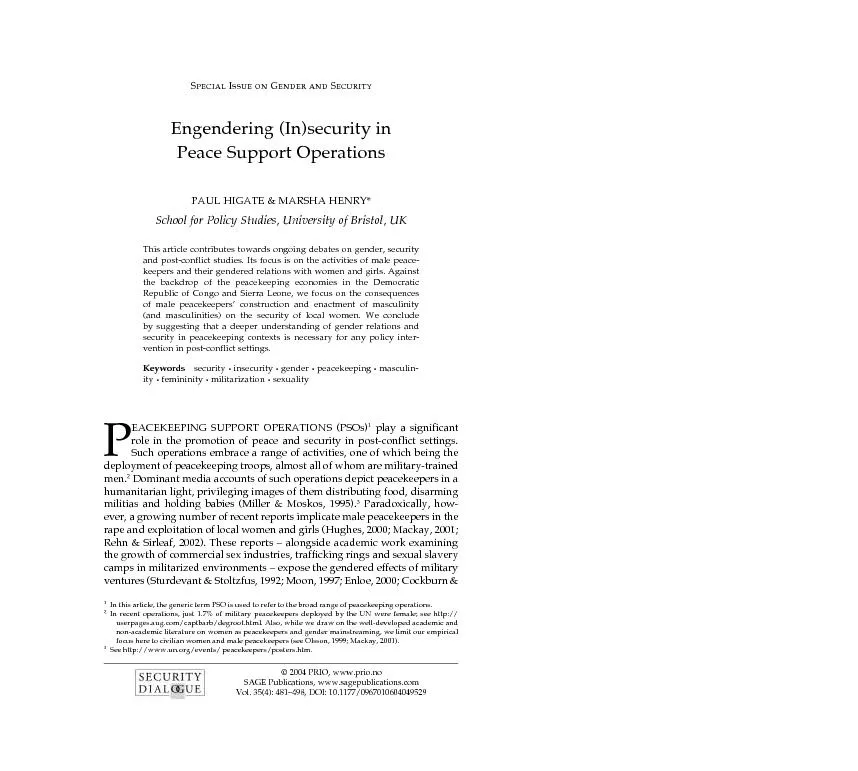
/
contradictory terms. From its definition to its application in thecont contradictory terms. From its definition to its application in thecont

contradictory terms. From its definition to its application in thecont - PDF document

trish-goza
trish-goza . @trish-goza
Follow
390 views
Uploaded On 2016-08-27

contradictory terms. From its definition to its application in thecont - PPT Presentation

EST011 2006 AACE International Transactions EST01Mr Larry R Dysert CCC In figure 1 the point estimate the estimated value beforecontingency has a value of 10 million In this example thepoi ID: 457111

EST.01.1 2006 AACE International Transactions EST.01Mr. Larry

Share:

Link:

Embed:

Download Presentation from below link

Download Pdf The PPT/PDF document "contradictory terms. From its definition..." is the property of its rightful owner. Permission is granted to download and print the materials on this web site for personal, non-commercial use only, and to display it on your personal computer provided you do not modify the materials and that you retain all copyright notices contained in the materials. By downloading content from our website, you accept the terms of this agreement.


Presentation Transcript

contradictory terms. From its definition to its application in thecontrol of projects, ten different people will often have tendifferent views on the subject. This paper will present the author’sviewpoint on the topic.What is a Cost Estimate?Cost estimating is the predictive process used to quantify,cost, and price the resources required by the scope of aninvestment option, activity, or project. The output of theestimating process, the cost estimate, is typically used to establishdetermining the economic feasibility of a project;evaluating between project alternatives; andproviding a basis for project cost and schedule control.scope [1].” While this definition does describe a cost estimate, Ibelieve it fails to fully portray the uncertainty involved withestimates. I favor describing a cost estimate as, “a prediction of thebe completed at a defined location and point of time in thefuture.”An estimate is a prediction of the expected final cost of aestimate involves assumptions and uncertainties, and is thereforeassociated with some level of error. We can correlate this level oferror and uncertainty to probabilities of over-running orunder-running the predicted cost. So given this probabilisticpoint number or cost. Instead, an estimate actually reflects a rangeassociated with a probability of occurrence.Now, typically we identify a single cost value (within therange of potential costs) as the estimate value, however we mustalways understand the uncertainty associated with that singlepoint value, and the true probabilistic nature of an estimate.techniques, we usually calculate a single point value as theestimated cost. When preparing detailed estimates, as the sum ofmany individual estimating algorithms, we also calculate theestimate total as a single point value. However, let’s alwaysjust one point on a probability distribution curve that representsMost of the end uses of an estimate require a single pointvalue within the range of probable values to be selected. Forexample, when used to develop a project funding amount orbudget, we must select a single value to represent the estimate.When taking into account the uncertainty associated with anestimate, we thus add an amount (contingency) to the initiallydeveloped point value to represent the final estimate cost. Whendoing so, we must take into account such things as the accuracyfactors in selecting the best single point value to represent theindication of the degree to which the final cost outcome of aproject may vary from the single point value used as thebe regarded as a probabilistic assessment of how far a project’sfinal cost may vary from the single point value that is selected toEstimate accuracy is traditionally represented as a +/-percentage range around the point estimate; with a stated confi-discussed above), an estimate can be represented as a probabilitydistribution curve. Figure 1 illustrates the concept of estimateaccuracy in relation to the estimate’s probability distribution. EST.01.1 2006 AACE International Transactions EST.01Mr. Larry R. Dysert CCC In figure 1, the point estimate (the estimated value beforecontingency) has a value of $1.0 million. In this example, thepoint estimate has a greater than 50 percent probability of being$0.8 million on the low side and $1.4 million on the high side. Inother words, 80 percent of the area under the probability distribu-percentage around the point estimate of $1.0 million, the accura-When accuracy range is expressed as a percentage, it is alwaysimportant to note whether it is the percentage range around thepoint estimate before contingency, or whether it is around thepoint estimate value including contingency. This importantdistinction can be appreciated by examining figure 2. In this case,the estimate probability distribution is identical to that in figure 1,still bounded by the values of $0.8 million and $1.4 million.However, when expressed as a percentage around the pointestimate including contingency ($1.1 million), the accuracyrange is now -27 percent to +27 percent.the range expressed as a percentage is different. Unfortunately,many estimators fail to note whether a +/- accuracy percentage isapplicable to the point estimate before contingency, or the esti-mate including contingency. As you can see, the difference isextremely important.(i.e., the range of probable values narrows) as the level of projectdefinition improves. In terms of AACE International’sclassifications of estimates, increasing levels of project definitionare associated with moving from Class 5 estimates, to Class 4estimates, and eventually to Class 1 estimates (associated with thehighest level of project definition). Figure 3 illustrates thisengineering complete. As shown in figure 3, and described inAACE International’s Recommended Practiceson Estimate, there is no absolute standard range on anyestimate or class of estimate. For the process industries, typicalTypical Class 5 Estimate:High range of from +30 percent to +100 percentLow range of from –20 percent to –50 percentTypical Class 4 Estimate:High range of from +20 percent to +50 percentLow range of from –15 percent to –30 percentTypical Class 3 Estimate:High range of from +10 percent to +30 percentLow range of from –10 percent to –20 percentThis common +/- percent measure associated with an EST.01.2 2006 AACE International Transactions Figure 1—Estimate Accuracy Range around the Point Estimate Figure2—Estimate Accuracy Range around Estimate Figure 3—Estimate Accuracy Improves as the Level of ProjectDefinition Improves each individual estimate will be associated with a differentprobability distribution explaining its unique level of uncertainty.project definition) is an important determinant of estimateaccuracy, there are many other factors which also affect it. Someof these other factors include the quality of reference costestimating data (material pricing, labor hours, labor ware rates,etc.), the quality of the assumptions used in preparing theestimate, the state of new technology in the project, theexperience and skill level of the estimator, the specific estimatingtechniques employed, the desired use of the estimate, the level ofmarket conditions (such as periods of rapid price escalation andIn addition, other factors that affect estimate accuracy are theproject team’s capability to control the project, and the capabilitylow ranges of typical estimate accuracy are themselves variable. Itis simply not possible to define a precise range of estimateaccuracy based solely on the percentage of engineering completeor class of estimate. Any specific estimate may not exhibit thepatterns shown above. It is possible to have a Class 5 estimate witha very narrow estimate range, particularly for repeat projects withgood historical costs upon which to base the estimate. Conversely,When discussing estimate accuracy, it is also important tomethods, while important, are not usually the main problemduring the early stages of a project when estimate accuracy ispoorest. In the early phases of a project, effort should be directedtowards establishing a better design basis than concentrating onutilizing more detailed estimating methods.determined from an assessment of the design deliverables andrisk analysis studies will often be used for individual projects todetermine their accuracy range based on this type of information.From the resulting output of the risk analysis, the project budgetacceptable to management in order not to overrun the projectbudget. Estimate contingency is the amount added to the pointTo the estimator, contingency is an amount used in theestimate to deal with the uncertainties inherent in the estimatingthe originally derived point estimate to achieve a givenprobability of not overrunning the estimate (given relativestability of the project scope and the assumptions upon which theestimate is based). Contingency is required because estimating isnot an exact science. The word “estimate” implies a judgmental,probabilistic value; and the one sure thing we know about anestimate is that it is not “exact.”shown as a normal probability distribution around the estimatedvalue of $100. Since this is a normal probability distribution, theprobability of underrun (shown as the area under the curve to theleft of the vertical dotted line) equals 50 percent, the same as thehowever the accuracy range of the cost varies from $50 to $150, orUnfortunately, most items of cost in an estimate do notexhibit a normal probability distribution in respect to its potentialvariability. Most of the time, variability is more closely associatedwith a skewed distribution. Figure 5 shows the variability of anIn this example, the item has been estimated at $100; howexample shows that there is only a 40 percent probability of EST.01.3 2006 AACE International Transactions Figure 4—Variation of an estimate line item with normal Figure 5—Variation of an estimate line item with a skewed If we follow best estimating practices, if we accept that anestimate is a range of values (associated with a confidence level),if we associate a given point estimate with a probability ofconformity to the actual project result that is obtainable andrepeatable.1.“Cost Engineering Terminology,2.“,” , AACE International, August 19973.“,” 4.“,” Mr. Larry R. Dysert CCCConquest Consulting GroupVancouver, WA 98684-6991 EST.01.5 2006 AACE International Transactions